Networking report
Last updated: May 19, 2026
Pro feature: This feature is available on Pro plans only. If you’d like to upgrade your plan, please contact our support team.
Overview
The networking report sits under Reports > CRM > Networking and gives your team an aggregated view of how your organisation is building relationships with professional contacts. It pulls directly from the activities logged in the networking timeline and turns them into summary metrics, a time series chart, and a breakdown by location.
What the networking report shows
Summary metrics
Two metric cards appear at the top of the report, each showing a count for your selected period alongside a comparison to the equivalent previous period.
Metric | What it counts |
|---|---|
How many professionals have been added? | Professional contacts created during the selected period. If a location filter is applied, only contacts linked to those locations are counted. Imported contacts without a logged creator are excluded. |
How many networking activities have happened? | All networking activities (phone calls, emails, meetings, and notes) where the activity date falls within the selected period. |
Clicking a metric card switches the chart below to show that metric's data over time.
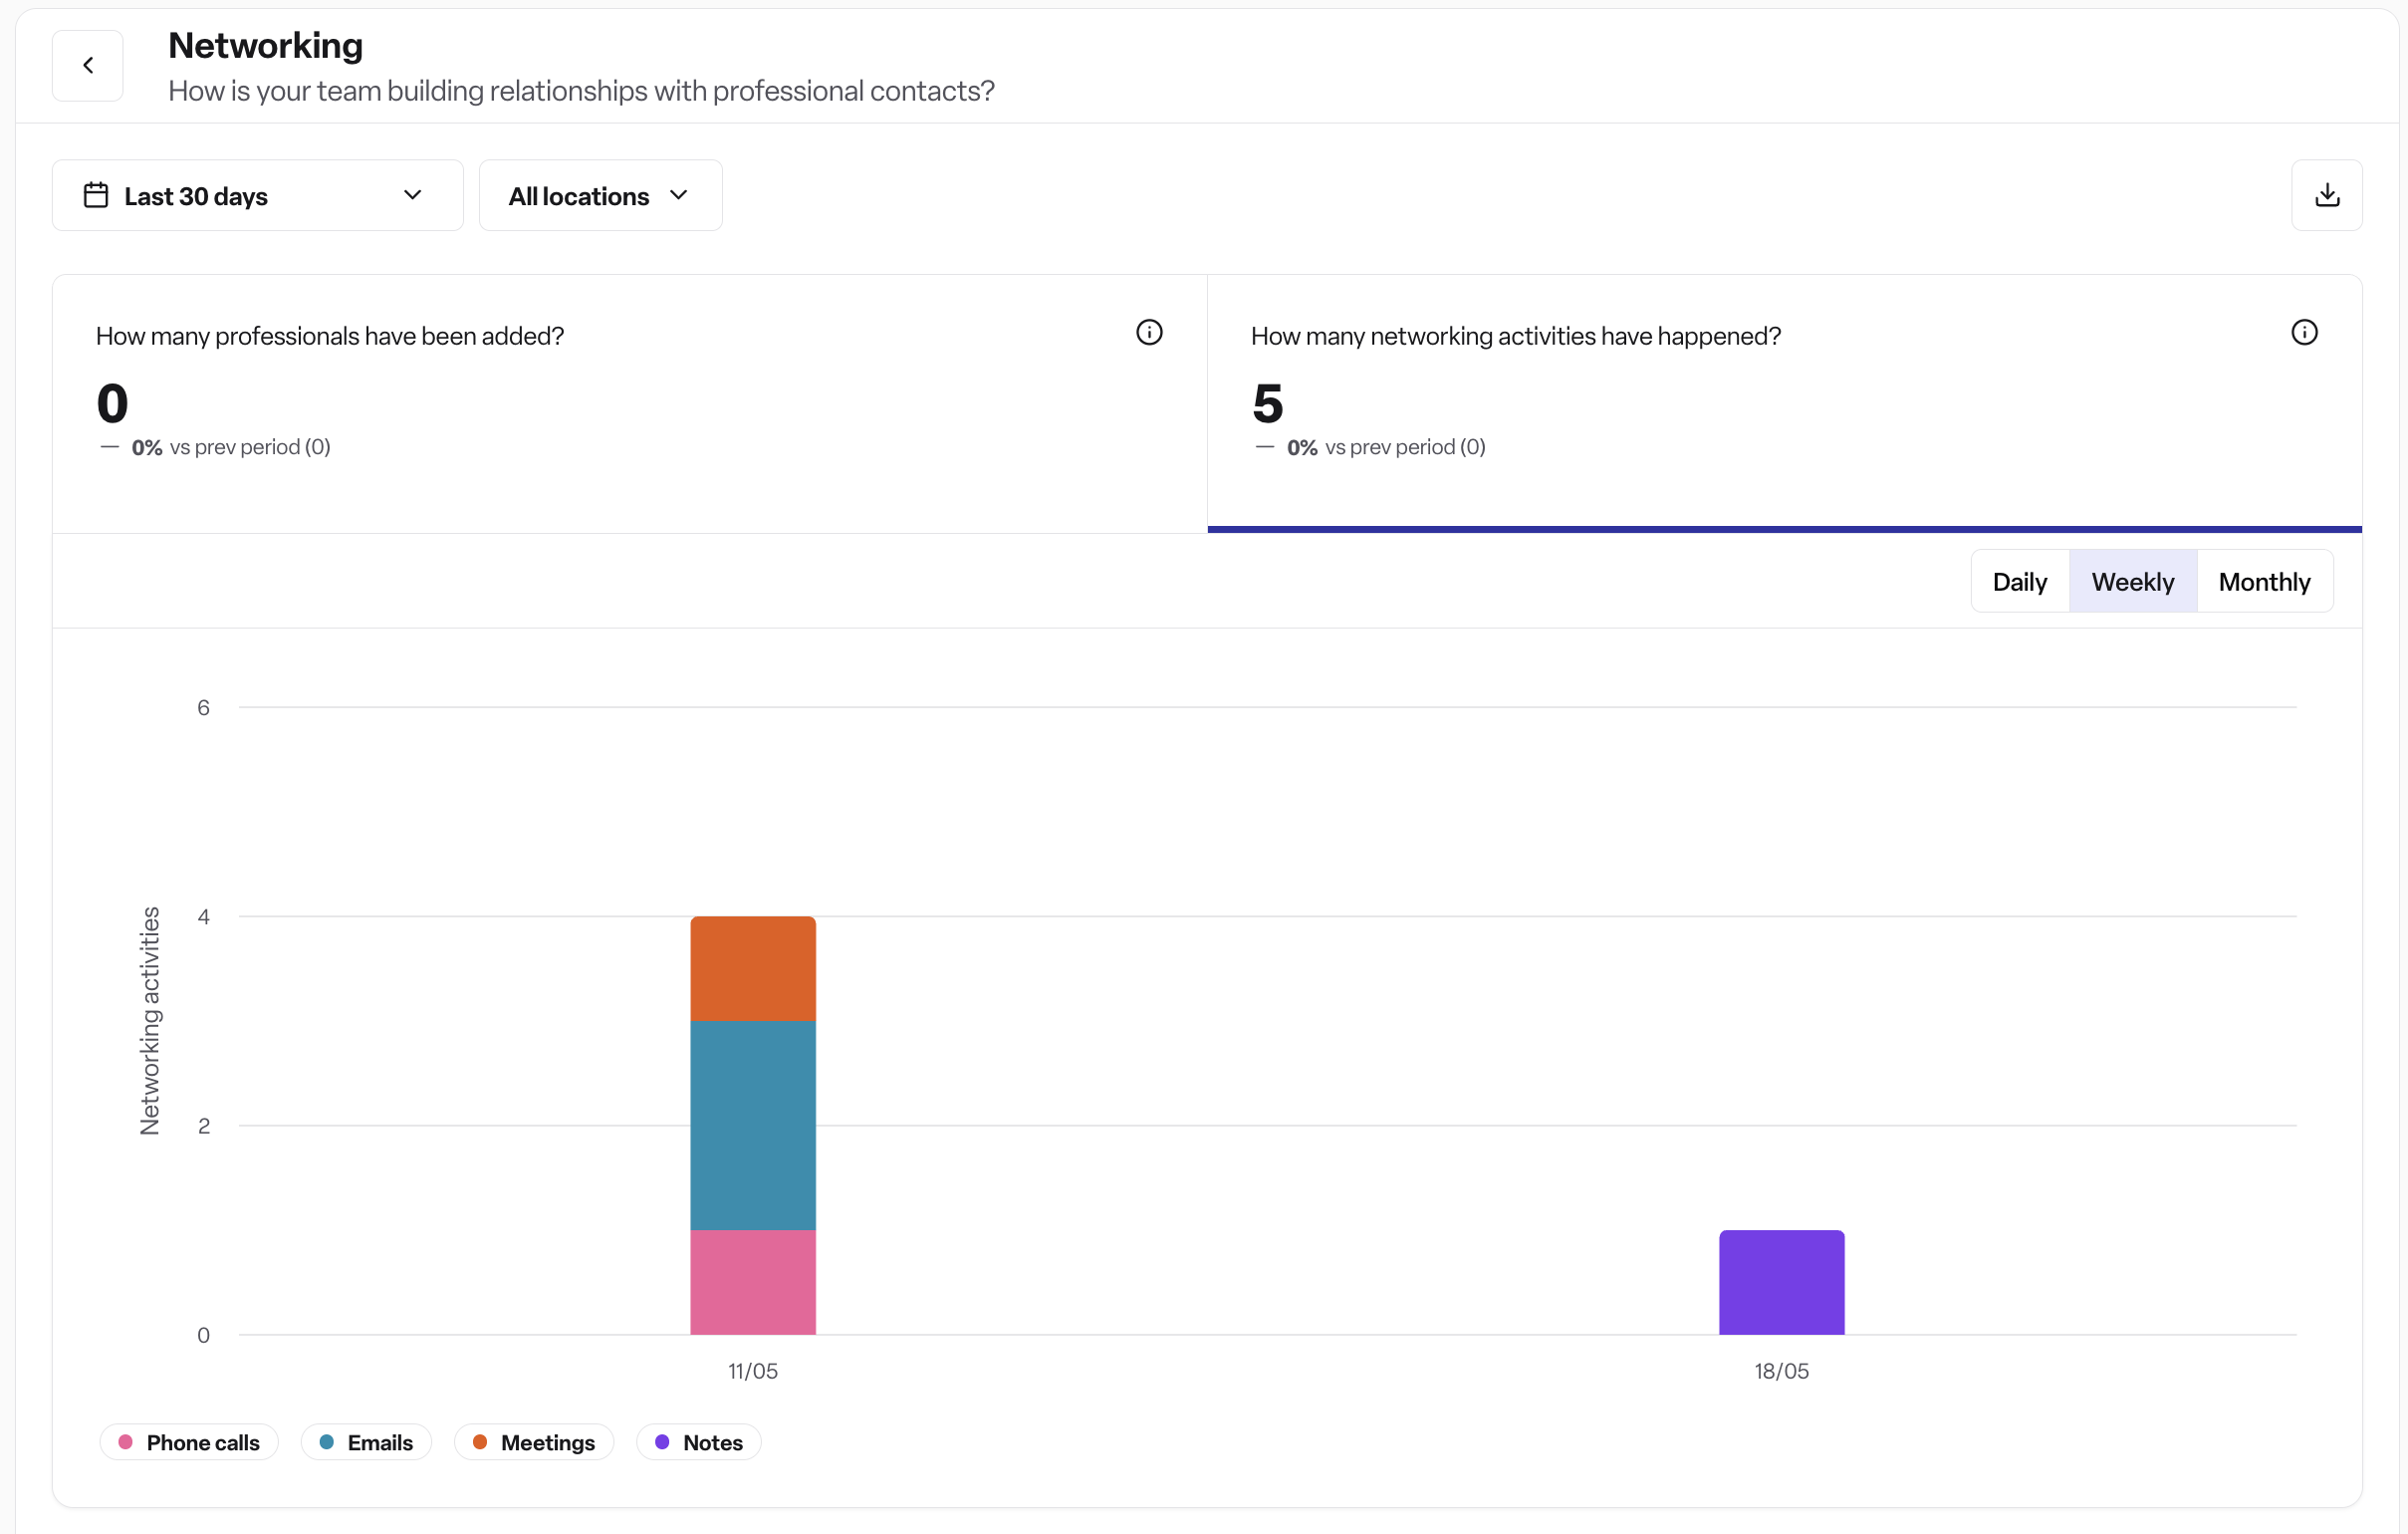
Time series chart
The chart shows the selected metric over time. Granularity adjusts automatically based on the date range you have selected, but can also be changed manually:
Granularity | Default date range |
|---|---|
Daily | Up to 14 days |
Weekly | 15 to 90 days |
Monthly | 91 days or more |
When viewing professionals added, the chart shows a single bar per time period.
When viewing networking activities, the chart shows a stacked bar broken down by type: phone calls, emails, meetings, and notes.
Volume by location table
Below the chart, a table labelled "Volume by location" lists every location you have access to with the following columns:
Column | What it shows |
|---|---|
Name | Location name, listed alphabetically |
Professionals added | Number of professional contacts added and linked to that location in the period |
Networking activity | Total number of networking activities logged at that location in the period |
Locations with no activity in the selected period are still included in the table with a count of zero.
How to use the networking report
Opening the report
Go to Reports > CRM and select Networking from the left-hand menu.
Setting a date range
Use the date range selector at the top of the report to choose the period you want to review. The maximum range is 365 days. The chart granularity will update automatically as you adjust the range.
The comparison figures shown on the metric cards always reflect an equal-length period immediately before your selected range. For example, if you select the month of June, the previous period shown will be the month of May.
Filtering by location
Use the location filter to narrow the report to one or more specific locations. When no location filter is applied, the report reflects all locations you have access to.
Switching between metrics
Click either metric card to switch the chart between professionals added and networking activities.
Downloading the table
Click the download button at the top of the report to export the location table as a CSV file. The export reflects whatever date range and location filters are currently active.
Why this is important to track?
Professional contacts are a key source of referrals and enquiries for your locations. Tracking how frequently your team is engaging with them gives visibility into an activity that would otherwise be invisible in your reporting.
Without a consistent log of networking activity, it is difficult to know whether relationships with professional contacts are being maintained, which locations are most active, or whether effort is increasing or declining over time. The networking report brings this into focus by turning individual activities logged by your team into a clear picture of relationship-building across your organisation.
Specifically, the report helps you to:
See whether activity is growing or declining. The comparison to the previous period on each metric card shows at a glance whether your team's outreach is trending in the right direction.
Understand which locations are most active. The volume by location table makes it easy to spot locations that are driving strong engagement as well as those that may need support or focus.
Hold teams accountable fairly. Because activities are logged against a specific location and team member, managers can have informed conversations with their teams based on real data rather than recollection.
Spot gaps before they become problems. A drop in activity volume can be an early indicator that relationships are going cold, giving you the opportunity to act before it affects referrals.
Rules and restrictions
Professional contacts only. The professionals added metric counts contacts of type "Professional" only. Other contact types are not included.
Imported contacts are excluded from the professionals added count. Contacts that were imported without a recorded creator (for example, data migrated from a previous system) are not counted. Only contacts created directly by a team member in Found are included.
Date range maximum is 365 days. You cannot select a range longer than one year.
Location access is scoped to your permissions. You can only see data for locations you have been granted access to.
Previous period is always equal in length to your selected range. It cannot be configured separately.
Data availability. Networking data is only available from 14 May 2026 onwards. If your selected start date is before this and you are viewing the professionals added metric, a banner will appear on the chart advising that those earlier dates will return no results.
Feature availability. Access to the networking report requires the networking feature to be enabled for your workspace. Speak to your administrator if you cannot see the report.
Frequently asked questions
Q: Where does the data in this report come from? A: All data comes from the networking activities logged by your team on professional contact profiles. See the Networking timeline article for details on how to log activities.
Q: Why does the "professionals added" count look lower than I expected? A: Two things can reduce the count. First, only contacts of type "Professional" are included. Second, any contacts imported from a previous system without a recorded creator are excluded — the metric only counts contacts that were actively added by a team member in Found. If a location filter is applied, only contacts linked to those locations are counted.
Q: What does the previous period comparison mean? A: Each metric card shows a figure for your selected date range alongside a figure for the period immediately before it, of equal length. This lets you see whether activity has increased or decreased compared to the prior period.
Q: Why is a location showing as zero in the table? A: Locations with no activity in the selected period are still listed in the table with a count of zero. This is intentional so you can see all locations at a glance, including those where no networking has taken place.
Q: Can I see a breakdown of activity types (phone calls, emails, etc.) by location? A: Not in the location table — that shows total activity counts only. To see a breakdown by activity type, use the time series chart and select the "networking activities" metric, which stacks the chart by type.
Q: Why is a banner appearing on my chart? A: The banner appears when you are viewing the professionals added metric and your selected start date is before 14 May 2026. Networking data is only available from that date, so earlier dates will return no results.
Q: What granularity does the chart use? A: The chart automatically selects daily (up to 14 days), weekly (15–90 days), or monthly (91+ days) based on your date range. You can also adjust the granularity manually using the picker on the chart.
Q: Can I export the data? A: Yes. The location breakdown table can be downloaded as a CSV using the download button at the top of the report. The export reflects your current date range and location filter.
Q: Why can I not see the networking report? A: The report requires the networking feature to be enabled for your workspace and appropriate access permissions. Contact your administrator if the report is not visible to you.
Q: Is the networking report available to all roles? A: Access depends on your permissions. Speak to your administrator if you believe you should have access but cannot see the report.