Closed insights
Last updated: May 7, 2026
Pro feature: This feature is available on Pro plans only. If you’d like to upgrade your plan, please contact our support team.
Overview
Closed insights is a report within Reports > Closed insights that helps you understand how enquiries are closing across your organisation. It answers three key questions: at what stage are enquiries being lost, why are they being lost, and how long do enquiries take to close — both when won and when lost.
This report is available on Found Pro CRM. Access is location-aware, meaning you will only see data for the locations you have permission to view.
The three charts
1. At what stage are we losing enquiries?
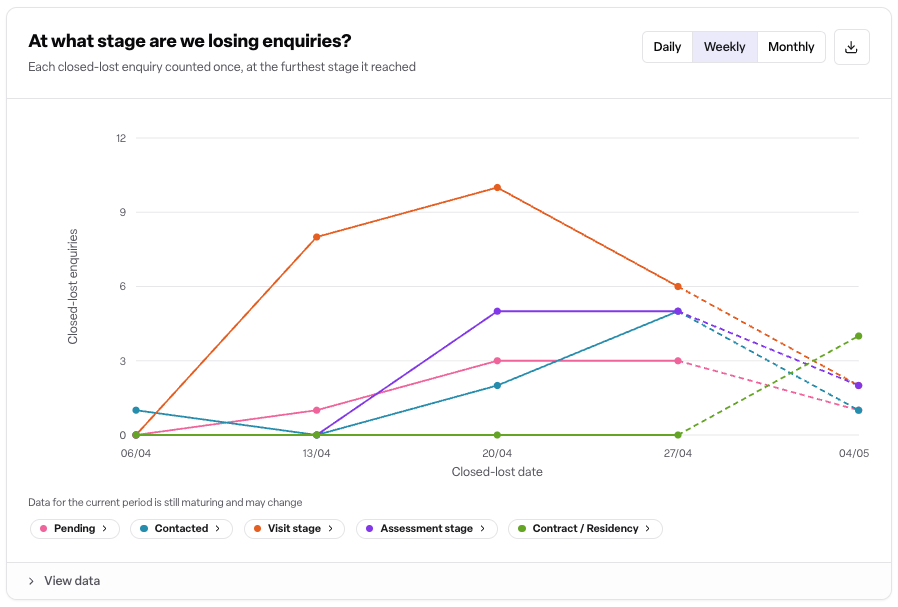
This chart shows your closed-lost enquiries grouped by the furthest stage each enquiry reached before it was closed. This helps you identify where in the sales journey you are losing the most potential residents.
Stages are grouped into five categories:
Stage group | What it covers |
|---|---|
Pending | Enquiries that were never progressed |
Contacted | Enquiry contact was attempted or made |
Visit stage | A visit was booked or completed |
Assessment stage | An assessment was booked or completed |
Contract / residency | A contract was sent, or a residency or care package was booked or started |
The chart plots these groups over time and supports day, week, or month granularity. Data in the current period is still accumulating and is marked as maturing.
2. Why are we losing enquiries?
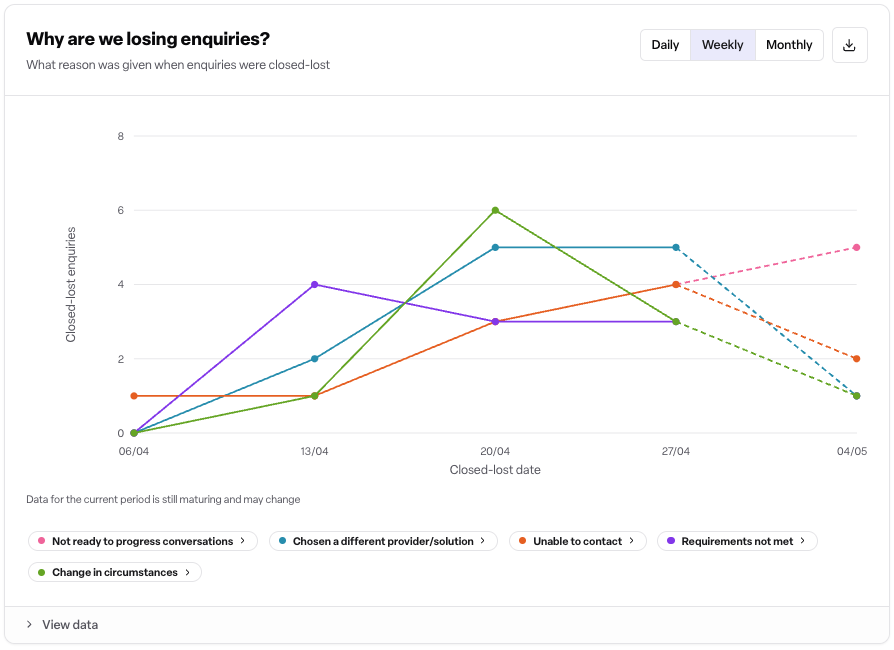
This chart shows closed-lost enquiries grouped by the reason category recorded when each enquiry was closed. It helps you identify the most common causes of lost enquiries.
You can drill into a reason category to see the specific sub-reasons within it. Use the breadcrumb at the top of the chart to navigate back to the top-level view. Enquiries closed without a reason recorded appear under Other.
Like the stage chart, this plots over time with granularity control and supports the same maturity notice for the current period.
3. How long until an enquiry closes?
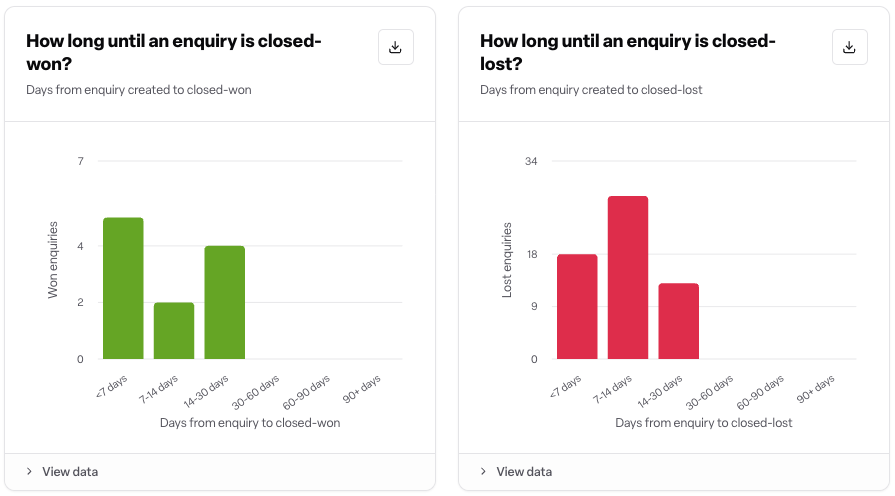
Two side-by-side charts show the distribution of time taken from enquiry creation to closure — one for closed-won enquiries and one for closed-lost enquiries.
Time is grouped into six buckets:
Less than 7 days
7–14 days
14–30 days
30–60 days
60–90 days
90 days or more
This helps you understand your typical sales cycle and spot outliers.
Filters
All three charts respond to the same set of filters, applied at the top of the report:
Date range — the time period to analyse
Location(s) — one or more locations to include
Location type — mailing address or billing address
Advanced filters — care type, purchase type, care duration, funding type, urgency, attribution source, contact method, enquiry reason, and professional referral status
Exclusions — remove enquiries closed with specific reason categories from the entire report (useful for filtering out internal or test closures)
Attribution mode — switch how enquiry sources are attributed
Exporting data
Each chart has its own export options:
CSV — downloads the underlying data as a spreadsheet
PNG — saves a screenshot of the chart
Access and permissions
Requirement | Detail |
|---|---|
Module | Found Pro CRM |
Who can view | All users with access to CRM reports in their role |
Location filtering | You only see data for locations you have permission to access |
If your workspace does not have the CRM module enabled, you will see an upgrade prompt instead of the report.
Frequently asked questions
Q: What does "closed" mean in this report? A: Closed refers to enquiries that have been marked as closed-lost — that is, enquiries that did not convert to a residency or booking. Closed-won enquiries (conversions) appear only in the time-to-close chart for comparison.
Q: Why does the current period show a maturity warning? A: Data for the current day, week, or month is still accumulating as new enquiries are closed or updated. The warning is a reminder that figures for the current period may change before the period ends.
Q: Can I see why enquiries were lost in more detail? A: Yes. In the "Why are we losing enquiries?" chart, you can click on any reason category to drill down into its specific sub-reasons. Use the breadcrumb to return to the top-level view.
Q: What if an enquiry was closed without a reason being recorded? A: Those enquiries are grouped into the Other category in the reasons chart. Ensuring closure reasons are always recorded will improve the accuracy of this report.
Q: How is the stage determined for each lost enquiry? A: The report uses the furthest stage the enquiry reached before it was closed. If an enquiry progressed to the visit stage and was then lost, it will appear in the visit stage group — not the stage it was at when first created.
Q: Does the time-to-close chart include all closures or just recent ones? A: It reflects all enquiries within your selected date range that were closed (won or lost) during that period. Adjusting the date range filter will change the data shown.
Q: Can I filter the report to a specific location? A: Yes. Use the location filter at the top of the report to focus on one or more locations. You can only select locations you have permission to view.
Q: Can I exclude certain closure reasons from the report? A: Yes. The exclusions control lets you remove enquiries closed with specific reason categories from all three charts simultaneously. This is useful if, for example, you want to exclude duplicate or test enquiries from your analysis.
Q: Can I export the data? A: Yes. Each chart supports both CSV and PNG export. The CSV download contains the underlying data in a tabular format; the PNG captures the chart as displayed.
Q: I cannot see this report — why? A: Closed insights requires the Found Pro CRM module. If you do not see it in your Reports menu, speak to your workspace administrator to confirm your module access and role permissions.