Enquiry funnel
Last updated: May 13, 2026
Pro feature: This feature is available on Pro plans only. If you’d like to upgrade your plan, please contact our support team.
Overview
The enquiry funnel is a CRM report that answers the questions: of the enquiries that came in during a selected period, how far did each one progress, how fast did they get there, and how does that compare to the previous equivalent period?
The report works by grouping enquiries into a cohort — all enquiries whose creation date falls within the date range you select. It then tracks each enquiry's journey through the workflow stages and presents the results across four sections:
Summary cards — average number of days from enquiry creation to each milestone stage, with a current vs prior period comparison
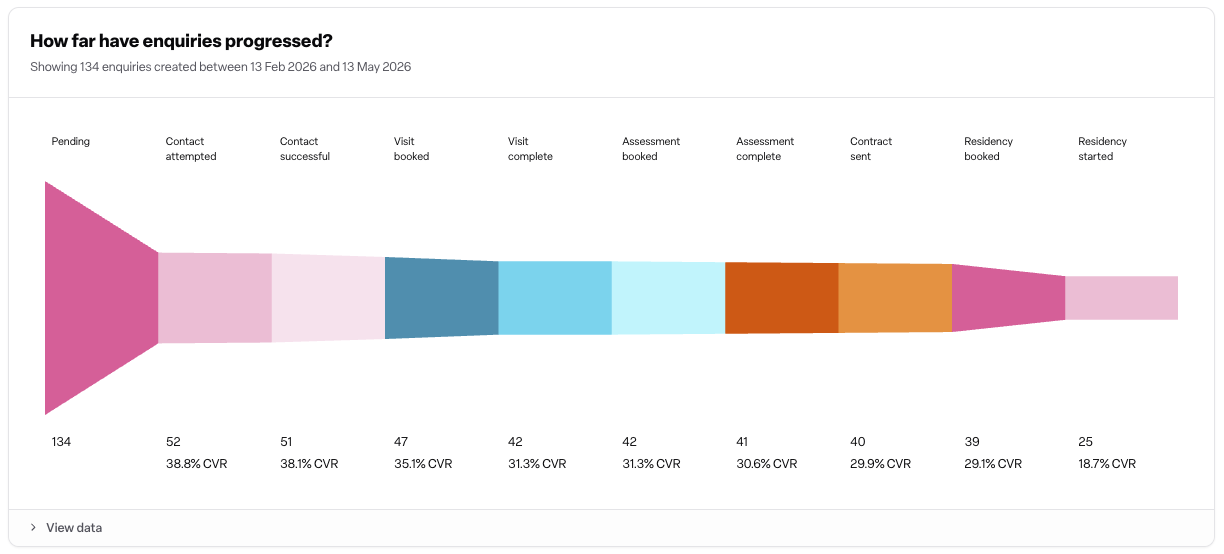
Funnel chart — total enquiries reaching each stage, with conversion rates (CVR) at each step
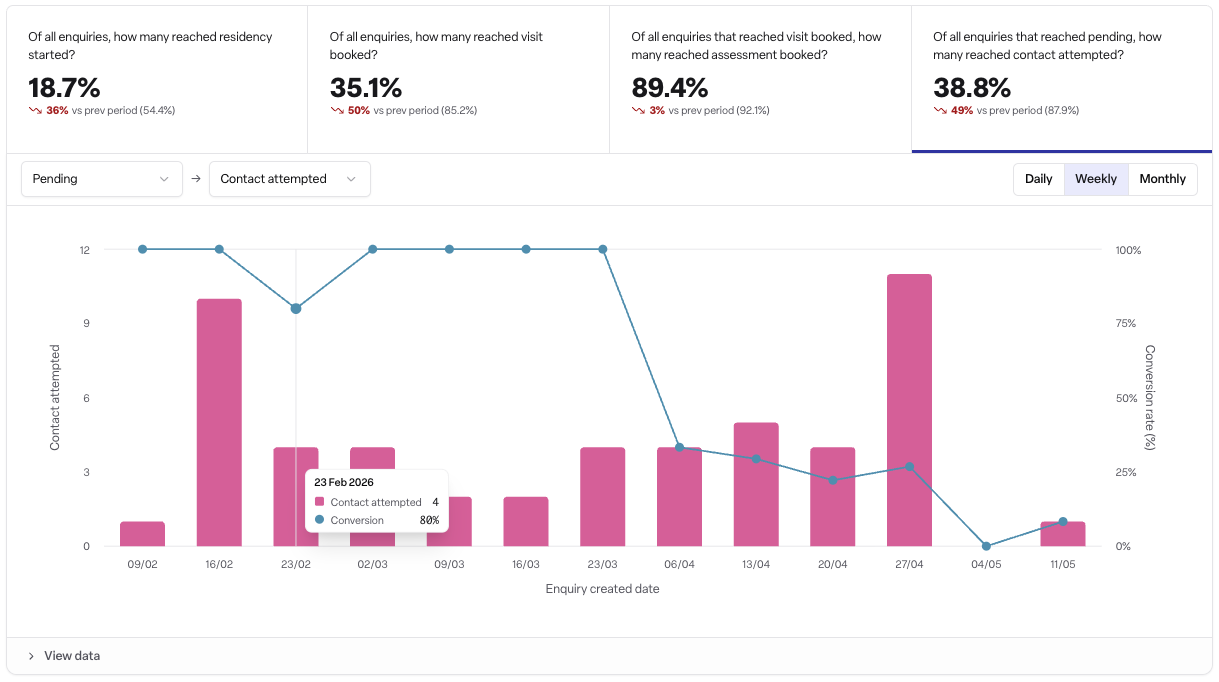
Conversion over time — a time-series view of a user-selected stage-to-stage conversion, with a prior period benchmark
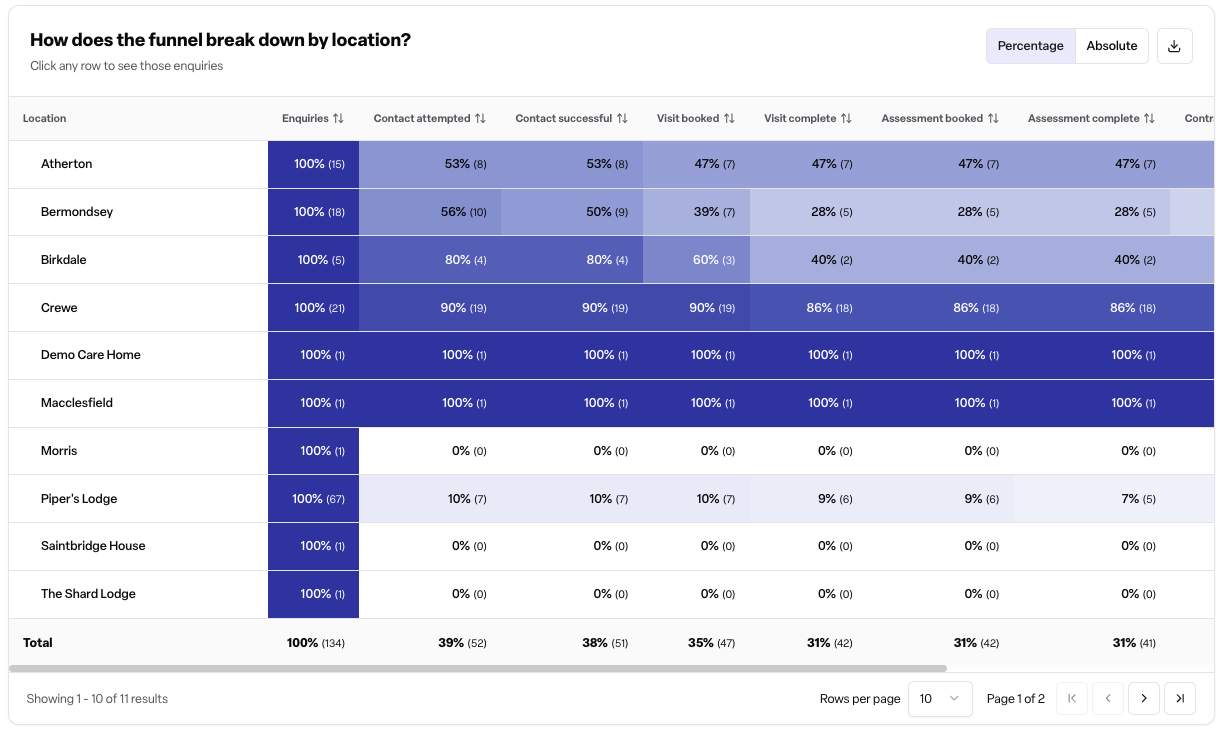
By-location table — the same funnel breakdown, split out per location
The report is available for care home and home care location types. Retirement living is not currently supported.
Filters and controls
The following filters are available across the report:
Filter | Description |
|---|---|
Date range | The window used to define the cohort. Defaults to the last three months. |
Locations | Limit the cohort to specific locations. Defaults to all locations you have access to. |
Category | Filter by location category values. |
Exclude lost reason categories | Remove enquiries closed-lost with selected reasons from all metrics. Useful for filtering out spam or test enquiries. |
Attribution model | Controls how source/channel data is resolved when filtering or breaking down by attribution source. Choose between digital (UTM tracking data) and self-reported ("how did you hear about us?"), with fallback options. |
Break down by | Segment the funnel chart (row 2) by care duration, care type, funding type, method of contact, or attribution source. Does not affect the other sections. |
Granularity | Day, week, or month bucketing for the conversion over time chart. Auto-derived from the date range length. |
The conversion over time chart also lets you pick a from stage and to stage to plot. The to stage must be downstream of the from stage in the workflow.
What the report shows
Summary cards
Each card shows the mean number of days from enquiry creation to reaching a milestone stage, across the enquiries in the cohort that reached it.
Care home cards:
Average days to reach contact successful stage
Average days to reach visit complete stage
Average days to reach assessment complete stage
Average days to reach residency booked stage
Home care cards:
Average days to reach contact successful stage
Average days to reach assessment complete stage
Average days to reach care package started stage
The prior period value is shown alongside the current value for comparison.
A card showing "—" means no enquiry in the cohort was eligible to contribute to the average. A card showing "0 days" means the enquiries that reached the stage averaged zero days — this is a real data point, not a display error, and typically occurs when enquiries are created already at or beyond the relevant stage.
Funnel chart
For each workflow stage, the funnel shows:
Count — how many enquiries in the cohort reached this stage
Previous count — the same count for the equal-maturity prior cohort
CVR from pending — count at this stage divided by the pending count (total drop-off from the top of the funnel)
CVR from previous stage — count at this stage divided by the count at the immediately preceding stage (step-by-step conversion)
Currently at stage — enquiries sitting at exactly this stage right now
Lost at stage — enquiries that were closed-lost at this stage
The pending row does not show CVR cells, as there is no upstream stage to compare against.
When a break down dimension is selected, the funnel is segmented by that dimension (for example, showing each funding type as a separate row per stage).
Conversion over time
This section plots the conversion rate between any two stages you select, bucketed by day, week, or month. A single horizontal benchmark line shows the prior period's overall conversion rate for the same stage pair, providing a reference without cluttering the chart.
The default view shows pending → residency started (care home) or pending → care package started (home care).
Changing the stage picker in this section does not reload the summary cards, funnel chart, or by-location table.
By-location table
This table mirrors the funnel chart but shows one row per location. The pending column is omitted — every enquiry in the cohort counts at pending by definition, so the column would simply repeat the total.
The table can be toggled between percentage mode (conversion rates per location) and absolute mode (raw counts per location). Clicking a row opens the enquiries for that location.
Care home and home care stage workflows
Care home stages (in order): Pending → Contact attempted → Contact successful → Visit booked → Visit complete → Assessment booked → Assessment complete → Reserved → Residency booked → Residency started
Home care stages (in order): Pending → Contact attempted → Contact successful → Assessment booked → Assessment complete → Care package booked → Care package started
Rules the report follows
Understanding these rules helps you read the numbers accurately.
Cohort membership is based on creation date only. An enquiry is in the cohort if it was created within your selected date range — regardless of its current status. Closed-lost and closed-won enquiries remain in the cohort alongside open ones.
Final stage, not highest stage. Each enquiry is counted at whatever stage it is at now (for the current cohort) or was at on the equivalent historical day (for the prior cohort). If an enquiry was moved back from a later stage, it counts at the lower stage. This matches how operators think about the report: where is this enquiry today?
Equal-maturity comparison. The prior cohort is observed for the same number of days since creation as the current cohort, not the same calendar dates. This prevents older prior enquiries from always looking better simply because they have had more time to progress.
Skip-ahead applies. When an enquiry is at a given stage, it counts as having reached every stage below it in the workflow. An enquiry created directly at contact successful, for example, counts at pending, contact attempted, and contact successful from day zero. An enquiry that jumps from pending to assessment complete counts at all the stages in between as well.
Frequently asked questions
Q: Why do my numbers look different from the funnel insights report? A: The enquiry funnel uses a different methodology. It tracks enquiries by their creation date and observes them using equal-maturity comparison, while the older funnel insights report measures stage activity within a date window. Found provides a help article explaining the differences in detail, accessible from the help button on the report page.
Q: Why does a summary card show "0 days" when I was expecting a higher number? A: A value of 0 days is real data — it means enquiries in the cohort that reached this stage averaged zero days to get there. The most common cause is that many enquiries were created already at or beyond that stage (for example, following a data import or where an integration creates enquiries in an advanced state). This is accurate reporting, not a bug.
Q: Why does a summary card show "—"? A: A dash means no enquiry in the cohort contributed to the average for that stage — typically because none of them reached it. This is distinct from 0 days and is displayed differently on purpose.
Q: Why is my prior period count lower than I expected? A: The prior cohort is observed using equal-maturity clipping. A prior enquiry that only reached a later stage after 60 days will not be counted at that stage if your date window is 30 days — because the comparison clips observations to the same 30-day maturity as your current cohort. This is intentional and makes the comparison fair.
Q: Can I use the report for retirement living locations? A: Not currently. The enquiry funnel supports care home and home care location types only. Retirement living is not yet supported.
Q: Does closing or losing an enquiry remove it from the funnel? A: No. Enquiries remain in their cohort regardless of whether they are open, closed-won, or closed-lost. You can use the "Exclude lost reason categories" filter to remove enquiries that were closed-lost with specific reasons (such as spam or test entries), but this filter must be applied explicitly.
Q: Why does an enquiry count at stages it never explicitly passed through? A: The report uses skip-ahead logic. When an enquiry reaches a stage, it is counted at all stages below it in the workflow order. This is intentional — operators in Found routinely skip stages, and excluding skip-aheads would significantly under-count conversions.
Q: Does changing the stage picker in the conversion over time chart affect the other sections? A: No. The conversion over time chart loads independently. Changing the from/to stage selection there does not reload the summary cards, funnel chart, or by-location table.
Q: What does the prior period benchmark line in the conversion over time chart represent? A: It shows the prior cohort's overall conversion rate for the selected stage pair as a single flat reference line, calculated using the same equal-maturity window as the rest of the report. It is not a bucketed time series — it is a single value giving you a benchmark to compare current-period buckets against.
Q: What is the attribution model filter and which option should I use? A: The attribution model controls how source and channel data is resolved when you filter or break down by attribution source. Digital uses tracking data from UTM links; Self-reported uses what the enquirer told you directly (for example, "how did you hear about us?"). Fallback options let you use one source and fall back to the other when data is missing. The default is self-reported with fallback to digital. If you are unsure, the default is a safe starting point for most teams.