Outbound calls report
Last updated: November 18, 2025
Overview
The Outbound calls report provides insights into your organisation's calling performance when contacting enquiries through the Lottie integration. This report helps you understand how effectively your locations are reaching out to potential residents and their families.
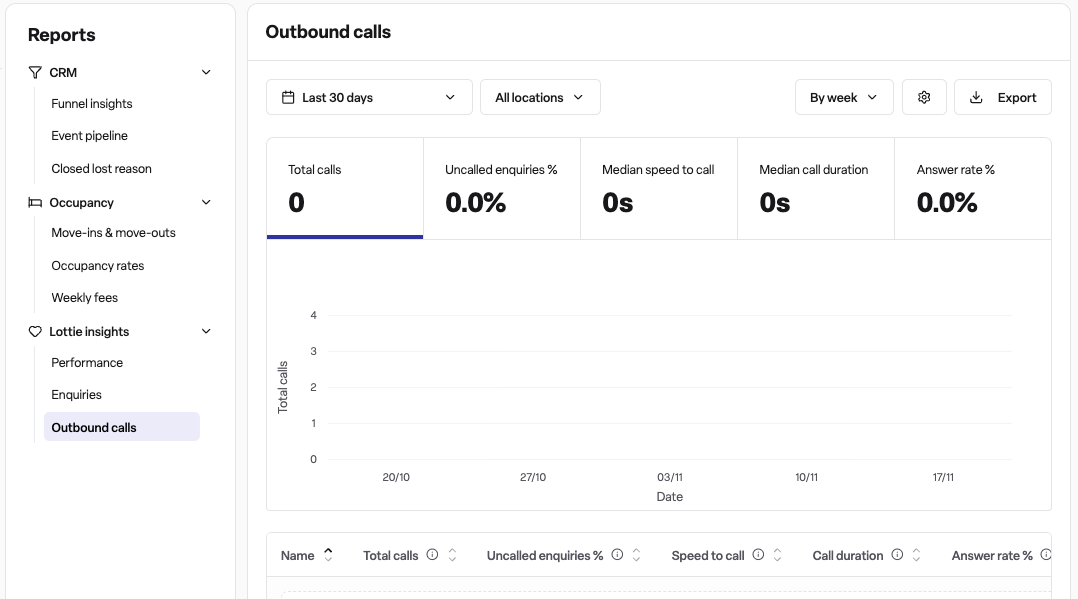
The report displays five key metrics with visual trend charts, plus a detailed breakdown by location. You can track total calls made, answer rates, how quickly your team responds to enquiries, call duration, and identify enquiries that haven't been contacted yet.
How to access the report
Navigate to Reports in the main navigation menu
Select Lottie Insights from the secondary navigation
Click on Outbound calls
Note: You'll need the appropriate permissions to view this report. If you don't see this option, contact your system administrator.
What the report shows
Summary metrics
Each metric includes a total value and a trend chart showing performance over your selected time period:
Total calls - The total number of outbound calls made to contacts
Answer rate % - The percentage of calls that were answered by the contact
Speed to call - The median time between when an enquiry was created and when your team first attempted to call them
Call duration - The median duration of calls that were answered
Uncalled enquiries % - The percentage of enquiries that haven't been called yet
Location breakdown table
Below the summary metrics, you'll find a table showing performance for each of your locations. The table displays:
Location name
Total calls made
Uncalled enquiries rate (%)
Median speed to call
Median call duration
Answer rate (%)
You can sort the table by clicking on column headers, and customise which columns are visible using the table settings.
How to use the report
Filtering your data
Time period selection
Use the timeframe selector to choose your date range:
Select from preset options (last 7 days, last 30 days, etc.)
Choose a custom date range using the calendar picker
Data is available from 1st April 2025 onwards
Location filtering
Use the location filter to focus on specific locations:
Select one or multiple locations from the dropdown
Leave empty to view all locations you have access to
Only locations with Lottie integration enabled will appear
Chart grouping
Choose how to group your trend data:
Day - View daily performance trends
Week - View weekly aggregated trends (default)
Month - View monthly aggregated trends
Analysing the data
Understanding answer rates
A higher answer rate indicates your team is successfully connecting with contacts. If you notice low answer rates at certain locations or time periods, consider:
Whether calls are being made at optimal times
If follow-up attempts are being made for unanswered calls
Monitoring speed to call
The speed to call metric shows how quickly your team responds to new enquiries. Faster response times typically lead to better conversion rates. Use this metric to:
Identify locations that may need additional resources
Compare performance across different time periods
Set benchmarks for your team
Identifying uncalled enquiries
The uncalled enquiries percentage highlights opportunities that may be falling through the cracks. Regular monitoring helps ensure:
All enquiries receive timely follow-up
Your team has adequate capacity to handle incoming enquiries
Processes are in place to prioritise urgent contacts
Exporting data
Click the export button above the locations table to download the data for further analysis or reporting.
Frequently asked questions
Q: Why don't I see all my locations in the report?
A: Only locations with Lottie integration enabled will appear in this report. Additionally, Retirement Living locations are not currently supported.
Q: What's the difference between median and average?
A: The report uses median values for speed to call and call duration. The median represents the middle value, which gives a more accurate picture of typical performance by reducing the impact of extreme outliers (very long calls or very quick responses).
Q: How is answer rate calculated?
A: Answer rate is calculated as the percentage of calls that were answered by the contact out of all calls attempted. For example, if 80 out of 100 calls were answered, the answer rate is 80%.
Q: Can I see individual call details?
A: This report provides aggregated metrics and location-level summaries. For individual call details, you'll need to access the enquiry record directly or contact your system administrator about accessing more detailed call logs.
Q: Why does the chart look different when I change the grouping?
A: Changing the grouping (day/week/month) affects how the data points are aggregated in the trend charts. Daily grouping shows more granular detail, while monthly grouping smooths out day-to-day variations to show longer-term trends.
Q: The report isn't showing any data. What should I check?
A: If you're not seeing data:
Ensure your selected date range is from April 1st, 2025 onwards
Check that you have locations with Lottie integration enabled
Verify you have the necessary permissions to view this report
Try removing any location filters to see if data appears
Q: How often is the data updated?
A: The report data is refreshed when you load the page or change your filter selections. The underlying call data is synced regularly with the Lottie integration system.
Q: Can I save my filter settings?
A: Your current filter selections are saved in the page URL, so you can bookmark specific views or share links with colleagues. When you return to a bookmarked URL, your previous filter selections will be restored.