Attribution report
Last updated: June 9, 2026
Overview
The attribution report is found under Reports > Attribution and is available to Found Pro CRM users. It answers the question: where are enquiries coming from, and which sources convert best?
The page contains three separate charts, each sharing the same date range, location filters, and attribution settings. Together they give a complete picture of how your marketing channels perform — from first enquiry through to booking and beyond.
The three charts are:
Enquiries by channel — which channels are generating enquiries over time
Bookings by channel — which channels are converting to bookings over time
Conversion funnel by channel — how enquiries from each channel progress through your CRM stages
Shared controls
All three charts on the page respond to the same set of controls.
Date range Select the start and end date for the period you want to analyse. The maximum range is 365 days. Data for any in-progress period (such as the current week or month) is shown with a dashed line and should be treated as preliminary — it will change as more records are created.
Location filter Filter by specific locations or by location categories. These two options are mutually exclusive. By default, all locations you have access to are included.
Filter menu Open the Filter button in the toolbar to access additional options:
CRM filters — narrow results by care type, purchase type, care duration, funding type, urgency, contact method, enquiry reason, and professional referral status.
Attribution model — controls how Found resolves attribution when an enquiry has both digital tracking data (UTM parameters) and self-reported data ("How did you hear about us?"). This setting appears at the bottom of the filter panel and applies to all three charts simultaneously.
Mode | How it works |
|---|---|
Digital, with self-reported fallback | Uses digital tracking first; falls back to self-reported if no digital data is available. This is the default. |
Self-reported, with digital fallback | Uses self-reported data first; falls back to digital if no self-reported data is available. |
Digital only | Uses digital tracking only. Enquiries without digital attribution appear as unattributed. |
Self-reported only | Uses self-reported data only. Enquiries without self-reported attribution appear as unattributed. |
Chart 1: Enquiries by channel
"Which channels drive the most enquiries?"
This is a line chart showing enquiry volumes over your selected date range. Each line represents an attribution channel. It answers the question: which marketing channels are generating the most inbound enquiries, and how is that changing over time?
Granularity Use the granularity picker on the chart to group data by daily, weekly, or monthly buckets. This setting is independent of the granularity picker on chart 2.
Drill-down The chart supports three levels of detail. Click a legend pill beneath the chart to drill into that channel:
Start at channel level (e.g. Digital, Professional referral)
Click to see subchannels (e.g. Organic search, PPC, LinkedIn)
Click again to see individual sources (e.g. a specific UTM source or professional contact name)
Use the back button to return to the previous level. Enquiries that cannot be attributed appear as Unattributed.
Export Download the underlying data as a CSV or save the current chart as a PNG. Exports reflect the current drill level.
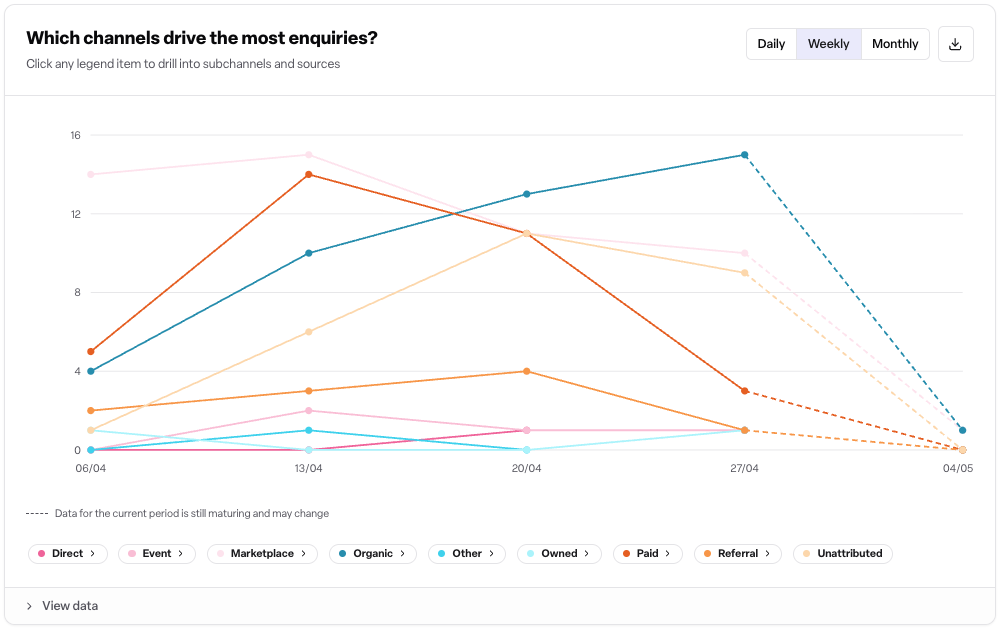
Chart 2: Bookings by channel
"Which channels drive the most bookings?"
This is a line chart showing the number of enquiries that resulted in a booking, broken down by attribution channel over time. It shows not just which channels generate enquiries, but which ones convert to confirmed bookings.
Granularity Use the granularity picker on this chart independently of chart 1.
Drill-down Identical drill behaviour to chart 1: click a legend pill to move from channel → subchannel → source, and use the back button to return. Unattributed entries are shown where no source can be resolved.
Export CSV and PNG export are available, reflecting the current drill level.
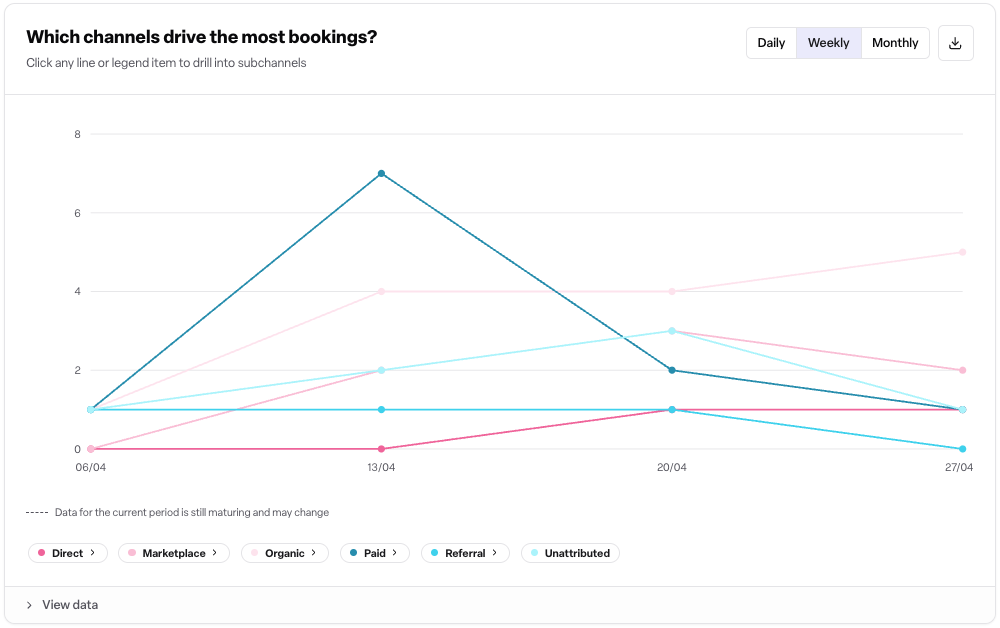
Chart 3: Conversion funnel by channel
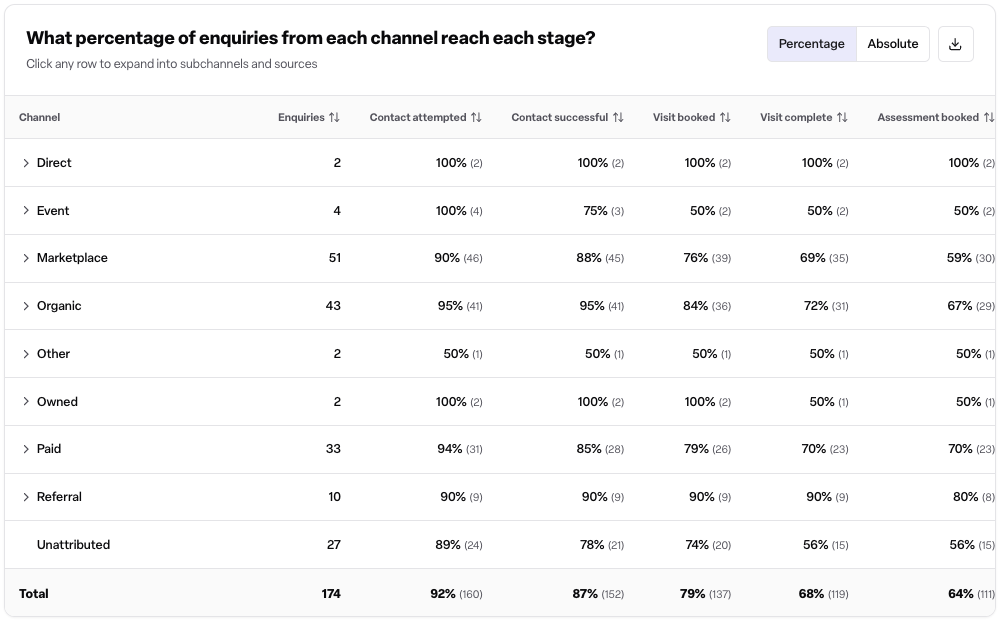
"What percentage/how many enquiries from each channel reach each stage?"
This is a table (not a line chart) showing how enquiries from each channel progress through your CRM workflow stages. Each row represents a channel and each column represents a stage in your enquiry workflow. It helps you identify where enquiries drop off and which channels produce the most engaged prospects.
Display mode Toggle between:
Percentage — shows the proportion of enquiries from each channel that reached each stage
Absolute — shows the raw count of enquiries that reached each stage
The enquiries column always shows an absolute count regardless of mode, as it is the denominator for all other columns.
Drill-down Click any row to expand it and see the breakdown by subchannel, then again to see individual sources. This works the same way as the two line charts above.
Export Export the table as a CSV. The export reflects the current display mode (percentage or absolute).
Rules and limits
The maximum date range across all three charts is 365 days.
In-progress periods are shown with a dashed line on the two line charts. A tooltip confirms that data is still maturing and may change.
Filtering by locations and filtering by location categories are mutually exclusive.
The attribution report requires the Found Pro CRM module to be active on your workspace.
All user roles — admin, manager, and staff — can view the report by default when the module is enabled.
Attribution is determined from the earliest activity recorded against an enquiry that carries attribution data. If no such activity exists, the enquiry creation date is used.
Frequently asked questions
Q: Why are there three charts on the same page? A: Each chart answers a different question using the same attribution data. Enquiries by channel shows you top-of-funnel volume. Bookings by channel shows downstream conversion. The conversion funnel shows how channels perform at every stage in between. Using all three together gives a fuller picture of channel quality than volume alone.
Q: What does "Unattributed" mean? A: An enquiry is unattributed when no source can be found under the current attribution mode. For example, in Digital only mode, any enquiry without UTM tracking data will appear as unattributed, even if it has a self-reported answer.
Q: Why does a period show a dashed line on the charts? A: The dashed line means that time bucket has not yet finished. If you are viewing weekly data and the current week is still in progress, Found shows enquiries and bookings recorded so far, but the total will continue to change. Treat dashed-line periods as preliminary.
Q: All three charts use the same filters — can I change one without affecting the others? A: The date range, location filter, CRM filters, and attribution model are shared across all three charts. The only settings that are independent per chart are the granularity picker (available on the two line charts) and the percentage/absolute toggle (available on the funnel table).
Q: Which attribution mode should I use? A: This depends on how much you trust each data source. Digital tracking via UTM parameters is captured automatically and is generally consistent. Self-reported data depends on enquirers answering the "How did you hear about us?" question. The default — digital with self-reported fallback — maximises the number of attributed enquiries while prioritising the more reliable source.
Q: Why might enquiry counts differ between the attribution report and other CRM reports? A: The attribution report filters enquiries by their attribution timestamp — the date the attributed activity was recorded — not necessarily the enquiry creation date. An enquiry created before your date range can appear in the report if its first attributed activity falls within the range, and vice versa.
Q: Can I see which professional contacts are driving referrals? A: Yes, if the Professional contacts feature is enabled on your workspace. Drill from the Professional referral channel through to the source level to see individual contact names.
Q: Can I compare two date ranges? A: Not within the report directly. Export the data from each period as separate CSVs and compare them outside of Found.
Q: I cannot see the attribution report — what should I check? A: The report requires the Found Pro CRM module to be active on your workspace. If you can see other CRM reports but not attribution, ask your administrator to check that your user role has the CRM reports permission enabled.
Q: Does switching the attribution model change my underlying data? A: No. Switching mode recalculates how attribution is resolved when the report loads, but does not alter any enquiry records. Your data is always intact regardless of which mode is selected.