Lottie insights: performance
Last updated: November 18, 2025
Overview
The Lottie Insights performance tab shows how your care locations are performing on the Lottie marketplace. It displays how care seekers discover and engage with your listings. This feature tracks the journey from a care seeker first seeing your location in search results, through to them taking action to enquire about your services.
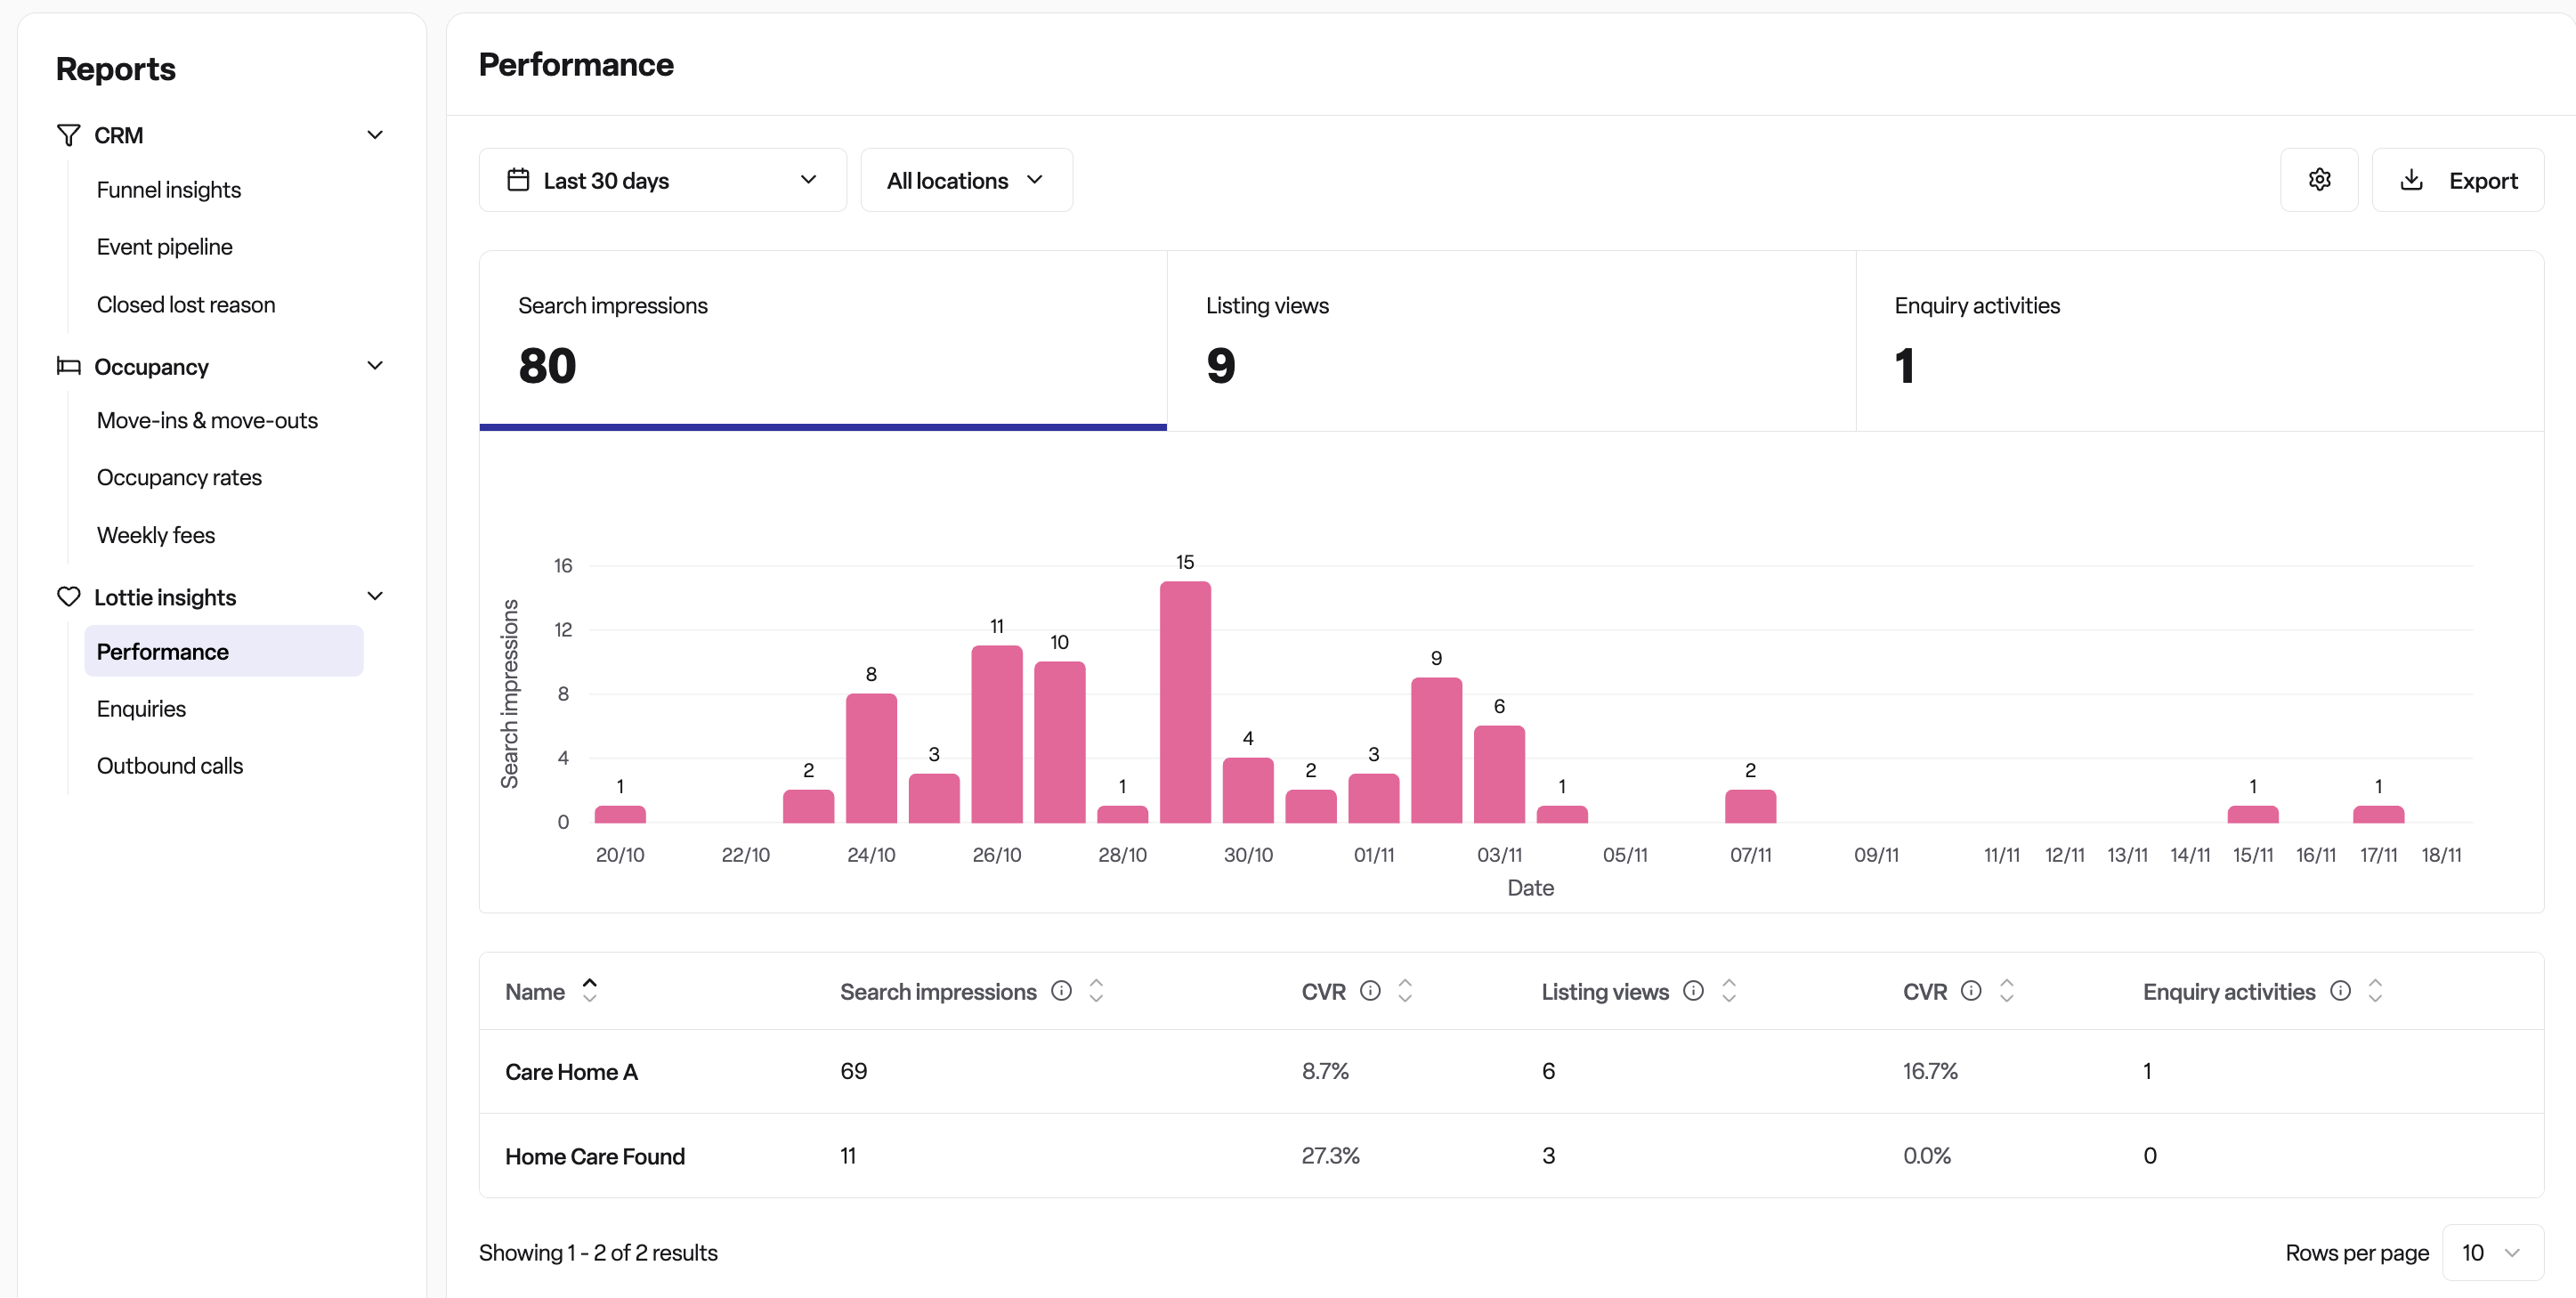
How to access Lottie Insights
Log into your Found account
Navigate to Reports in the main menu
Select Lottie Insights
Click on the Performance tab
The Performance tab will display automatically if you have access to Lottie Insights but not to CRM Reports.
Understanding the metrics
The three key metrics
Your performance data is organised around three core metrics:
1. Search impressions
The number of times your location appeared in a care seeker's search results on Lottie.
This metric shows how often your location is appearing in relevant searches on the Lottie marketplace.
2. Listing views
The number of times a care seeker clicked on your location to learn more on Lottie.
This metric shows how many people viewed your full listing after seeing it in search results.
3. Enquiry activities
The total count of all enquiry actions taken by care seekers, including:
Adding your location to their shortlist
Submitting an information request
Calling you directly from the listing
Requesting a call back through the Lottie concierge service
This metric represents genuine interest from potential customers.
Understanding conversion rates
Conversion rates show how care seekers progress through their journey with your listings.
Search conversion rate
Formula: (Listing Views ÷ Search Impressions) × 100
This shows what percentage of people who saw your location in search results clicked through to view it.
Listing conversion rate
Formula: (Enquiry Activities ÷ Listing Views) × 100
This shows what percentage of people who viewed your listing took action to enquire.
Using the performance dashboard
Summary section
At the top of the page, you'll see three cards displaying your total metrics for the selected time period. Click on any card to see a detailed chart showing how that metric has changed day by day.
Locations table
Below the summary, you'll see a detailed breakdown for each of your locations:
Location name | Your care home or service location
Search impressions | Total times this location appeared in searches
Search CVR | Conversion rate from impression to view
Listing views | Total views of this location's listing
Listing CVR | Conversion rate from view to enquiry
Enquiry activities | Total enquiry actions received
You can sort by any column to compare performance across your locations.
Customising your view
Selecting a timeframe
Use the timeframe selector to choose the date range you want to view:
Click on the timeframe dropdown
Select a preset option (e.g. "Last 30 days") or choose custom dates
The dashboard will update to show data for your selected period
Important: Lottie Insights data is available from 1st April 2025 onwards. Data before this date is not included.
Filtering by location
Use the location selector to focus on specific locations:
Click on the location dropdown
Select "All locations" to see combined data, or
Choose specific locations to compare them directly
The charts and table will update to show only your selected locations
Adjusting chart display
Click on Chart settings to customise how your data is visualised:
Chart types:
Area smooth – Curved line chart
Area – Straight line chart
Bar – Column chart
Display options:
Toggle "Show data labels" to display the exact value on each data point
Exporting your data
To export your performance data:
Click the Export button
A CSV file will download with all the data from the locations table
The filename will include your selected date range
Open in Excel or Google Sheets for further analysis
Important information
Data availability
Performance data is available from 1st April 2025 onwards. Data before this date is not included in the reports.
Who can access this feature
Access to Lottie Insights is controlled by your user permissions. If you need access and don't currently have it, please speak to your organisation's Found administrator.
What counts as "enquiry activities"
This metric includes all types of enquiries:
Shortlists – Care seekers saving your location for later
Information requests – Direct enquiries submitted through the form
Direct calls – Calls made by clicking your phone number on the listing
Concierge calls – Requests for the Lottie team to arrange contact