Lottie insights: enquiries
Last updated: November 18, 2025
What is the Lottie insights enquiries tab?
The Lottie Insights Enquiries tab provides a view of enquiry activity generated from your Lottie marketplace listings. This reporting tool helps you track how care seekers are engaging with your properties and monitor trends over time.
Location: Reports → Lottie insights → Enquiries
What data does it show?
The Enquiries tab tracks four key metrics:
Enquiry activities: Count of shortlist, information request, direct calls and concierge calls
Phone calls: Inbound phone calls from care seekers
Information requests: Care seekers who have requested more information
Shortlist referrals: Care seekers who have added your property to their shortlist
Key features
Summary metrics with trends
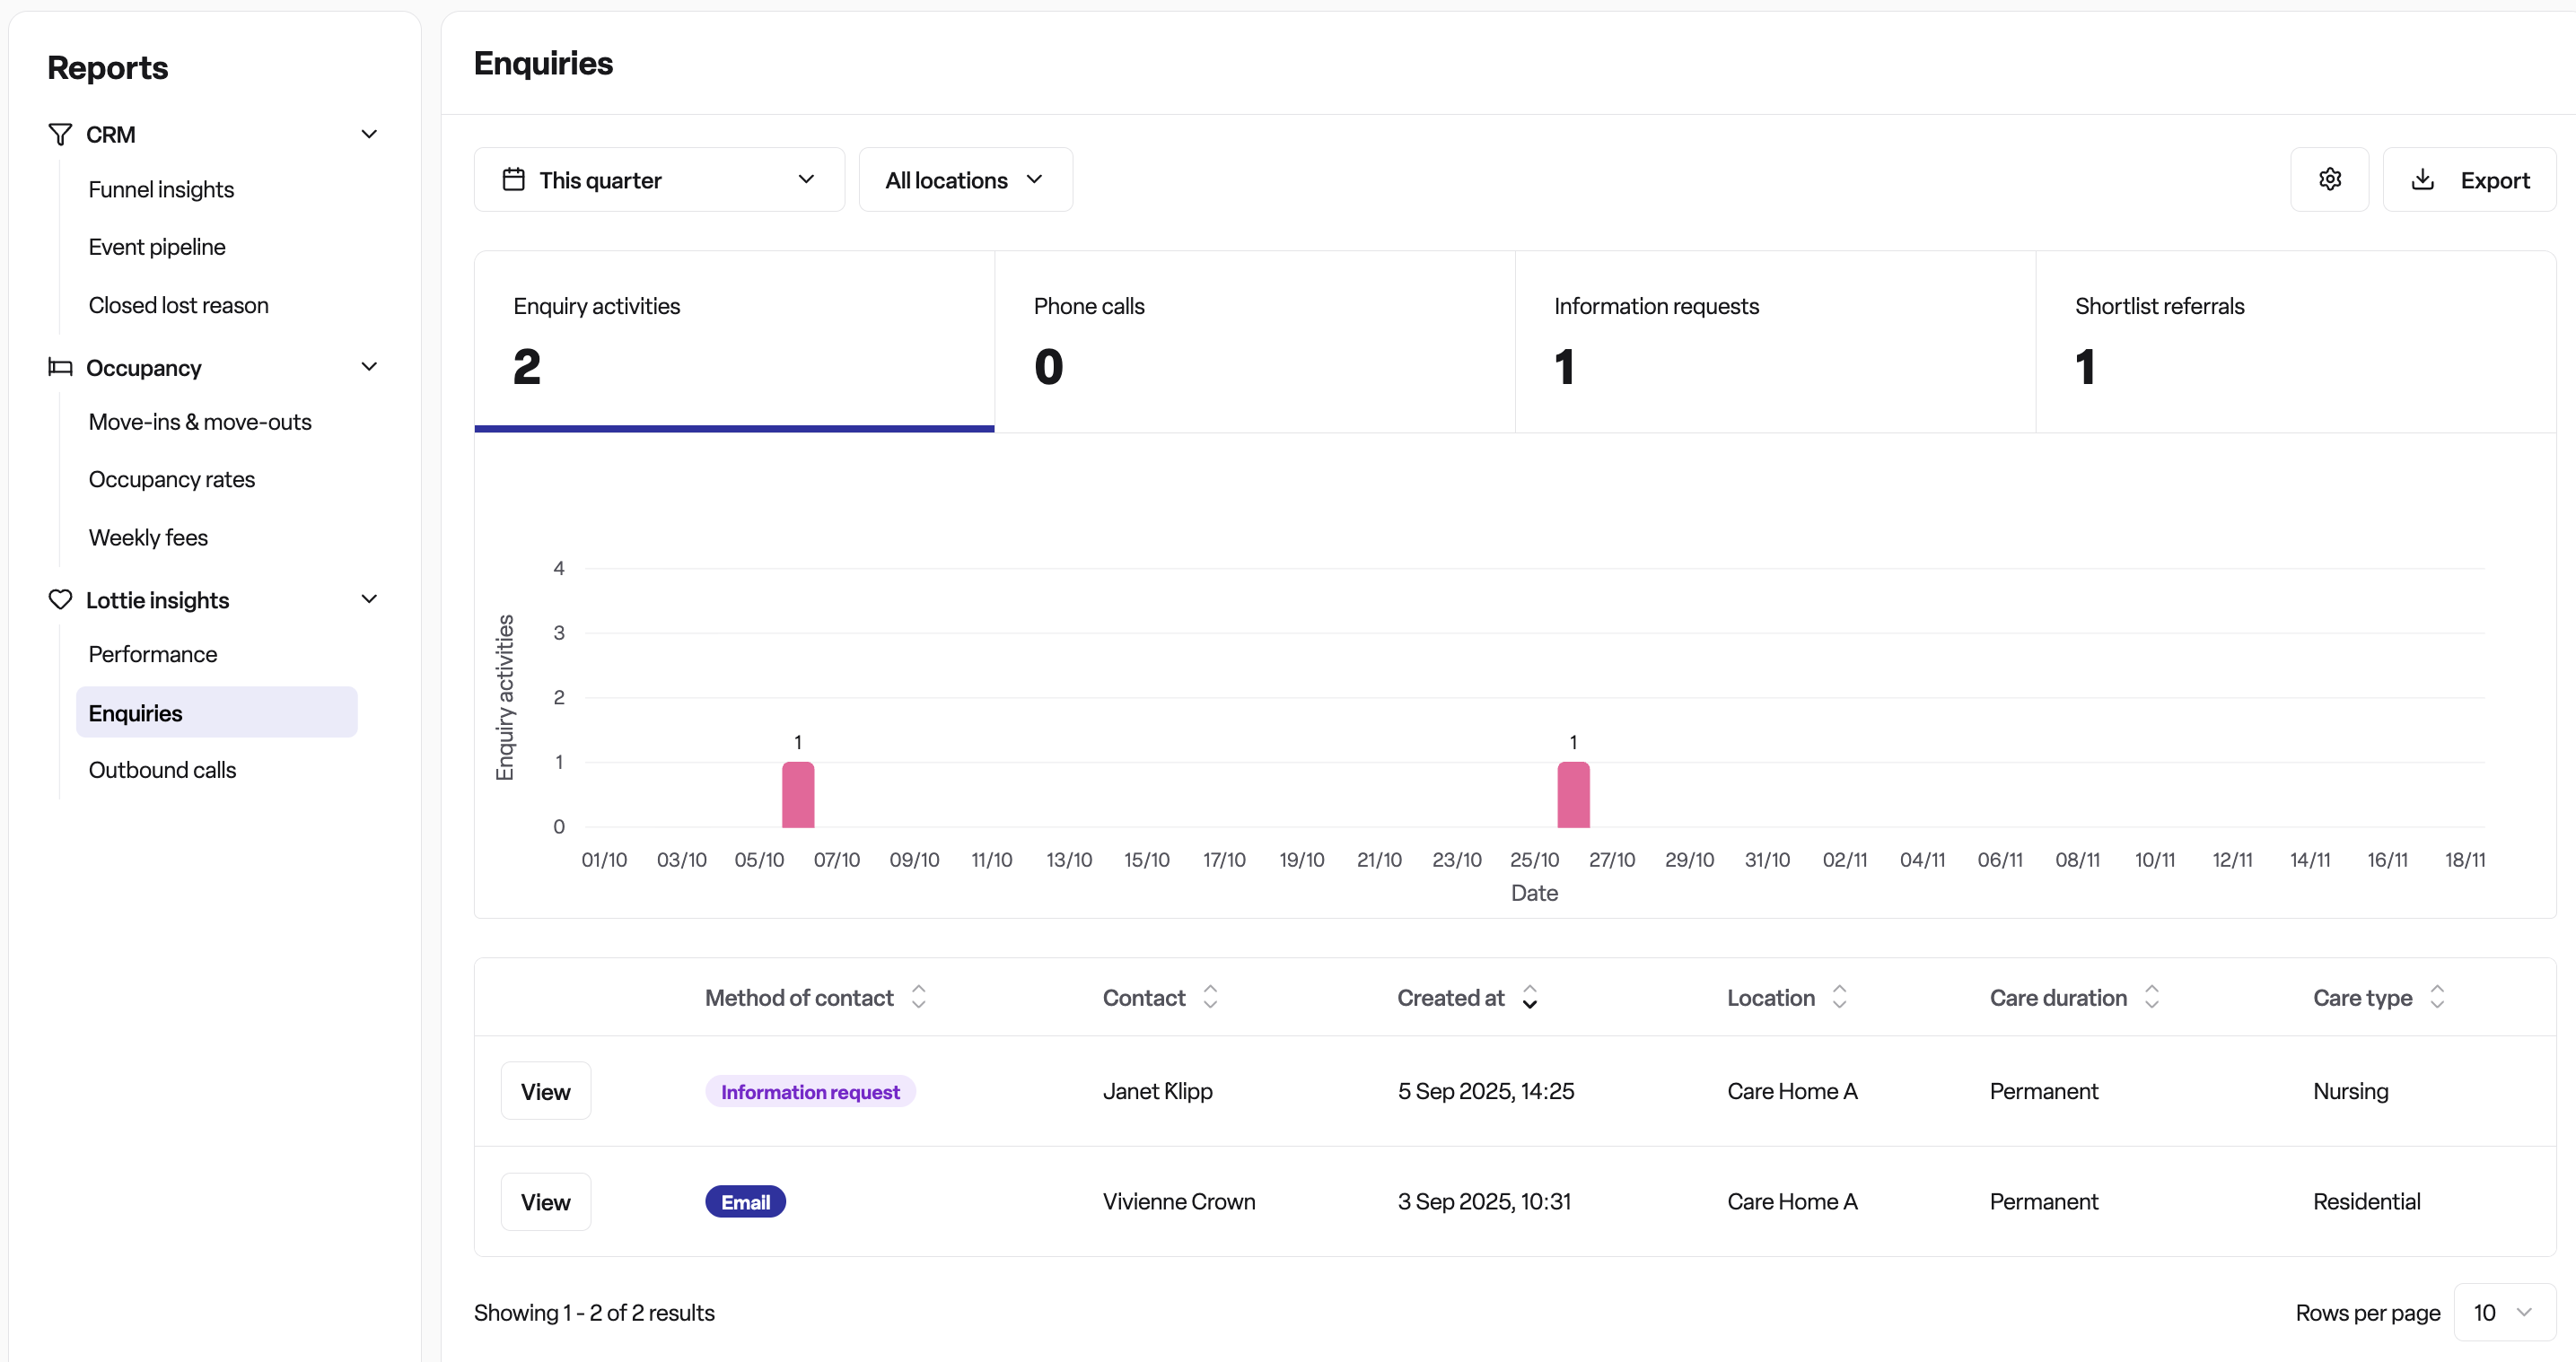
At the top of the page, you'll see four metric cards displaying your totals for each interaction type. Click on any metric card to view its trend over time in the chart below. The chart shows daily activity, helping you identify patterns and trends.
Flexible filtering
Date range selection
Choose from preset timeframes (Last 7 days, Last 30 days, etc.)
Or select a custom date range
Note: Data is available from 1 April 2025 onwards
Location filtering
View data for all your locations combined
Or filter by specific locations
Select one or multiple locations from the dropdown
Detailed enquiry activities table
Below the summary chart, you'll find a detailed table showing individual enquiry activities, including:
View button: Links to the full enquiry details
Contact method: How the care seeker reached out, displayed as a badge
Contact name: The care seeker's name
Created at: When the enquiry occurred
Location: Which property they enquired about
Care duration: The duration of care requested
Care type: Care home or home care services
Click the "View" button on any row to see the full enquiry details.
Export your data
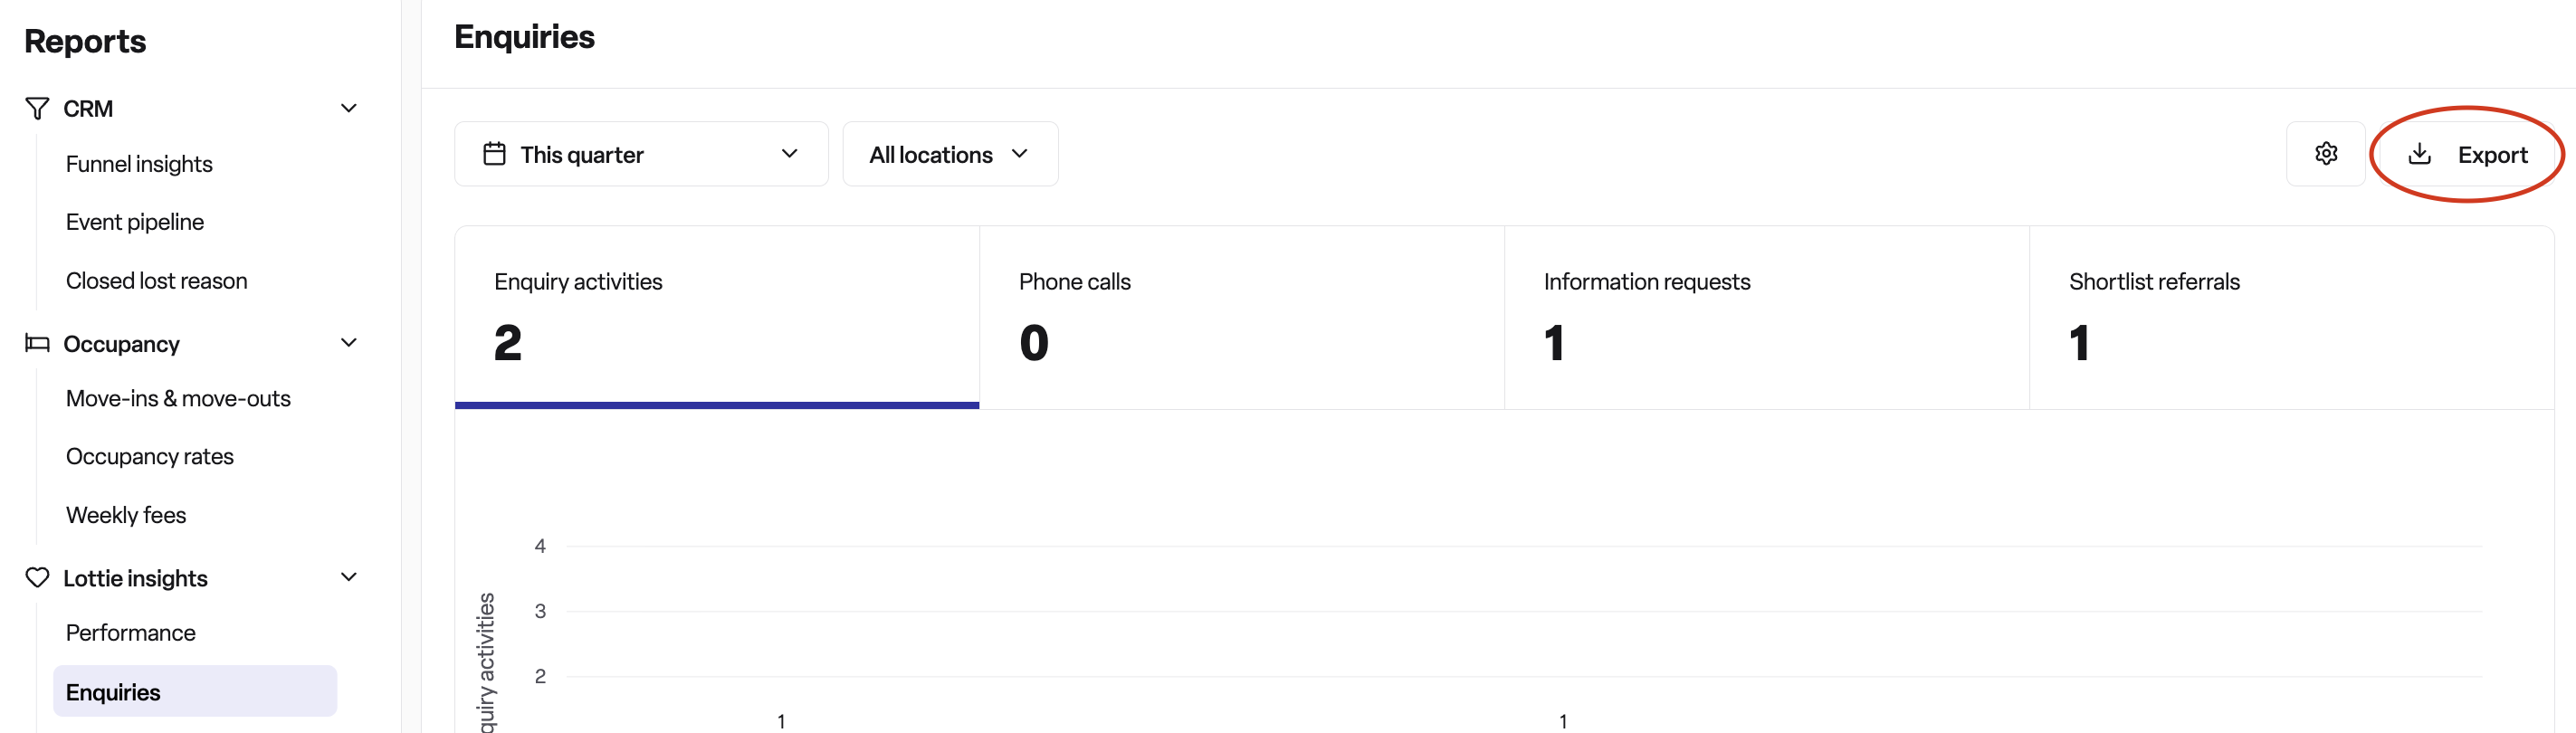
Click the Export button to download your filtered enquiry data as a CSV file. The file will be named with the format lottie-enquiries-YYYY-MM-DD-YYYY-MM-DD.csv based on your selected date range.
Customisable visualisations
Use the Chart settings menu (gear icon) to customise how your data is displayed:
Chart types:
Area spline chart: Smooth interpolated line with filled area
Area chart: Line chart with filled area
Bar chart: Column display
Display options:
Show data labels: Toggle to display exact numbers on each data point
How to use the Lottie insights: enquiries tab
1. Access the report
Navigate to Reports → Lottie insights → Enquiries from the main menu.
2. Select your timeframe
Use the date selector to choose the period you want to analyse. You can select preset options or choose a custom date range. The earliest date you can select is 1 April 2025.
3. Filter by location (optional)
If you manage multiple properties:
Select "All locations" to see combined performance
Choose specific locations to view individual property performance
You can select multiple locations at once
4. Analyse the summary metrics
Review the four metric cards at the top to understand your enquiry volume. Click on any metric card to view its trend in the chart below.
5. Review the trend chart
The chart shows daily activity over your selected timeframe. Use the chart settings to switch between different visualisation types and toggle data labels on or off.
6. Examine individual enquiries
Scroll down to the activities table to see specific enquiries. The table is sorted by created date (newest first) by default. Click "View" to see full enquiry details.
7. Export for further analysis
Click Export to download the table data as a CSV file for use in spreadsheet applications or other analysis tools.
Understanding your data
What counts as an enquiry activity?
Based on the data tracked, enquiry activities include shortlists, information requests, direct calls, and concierge calls from care seekers who found your listing on Lottie.
Date availability
The Lottie Insights Enquiries data is available from 1 April 2025 onwards.
Permissions
You need the "LottieInsights" permission to access this report. The data shown respects your location access permissions.
Tips for getting value
1. Regular monitoring
Check your enquiry metrics regularly to identify trends and respond to changes in enquiry volume.
2. Compare time periods
Use the date selector to compare different time periods and understand how your enquiry volume changes over time.
3. Location analysis
If you manage multiple properties, use the location filter to compare performance across different sites.
4. Export for record keeping
Regular CSV exports allow you to maintain historical records and create custom reports outside the system.
Frequently asked questions
Q: Why can't I see data before April 2025?
A: To ensure data accuracy, Lottie Insights enquiry data is only available from 1 April 2025 onwards.
Q: Can I share this data with my team?
A: Yes, use the Export button to download a CSV file. You can also share the page URL - your selected filters are preserved in the link.
Q: What's the difference between "Enquiry activities" and the other metrics?
A: "Enquiry activities" is the total count of all interaction types (shortlists, information requests, direct calls, and concierge calls). The other three metrics show specific subsets of these interactions.
Q: I don't see expected enquiries. Why?
A: Ensure you've selected the correct date range and location filters. Verify that the enquiries fall within the date range from 1 April 2025 onwards. If you still don't see expected enquiries, contact support.
Q: Can I customise which columns appear in the table?
A: Yes, the table supports column visibility preferences which are saved automatically using the storage key "lottie-insights-enquiries-activities".