Occupancy rates report
Last updated: December 2, 2025
Pro feature: This feature is available on Pro plans only. If you’d like to upgrade your plan, please contact our support team.
Overview
The Occupancy rates report helps you understand how efficiently you're using your available bed capacity across your care homes. This report shows you the percentage of beds that are occupied over time, helping you identify trends, optimise capacity planning, and make informed business decisions.
What the report shows
The report displays three main sections:
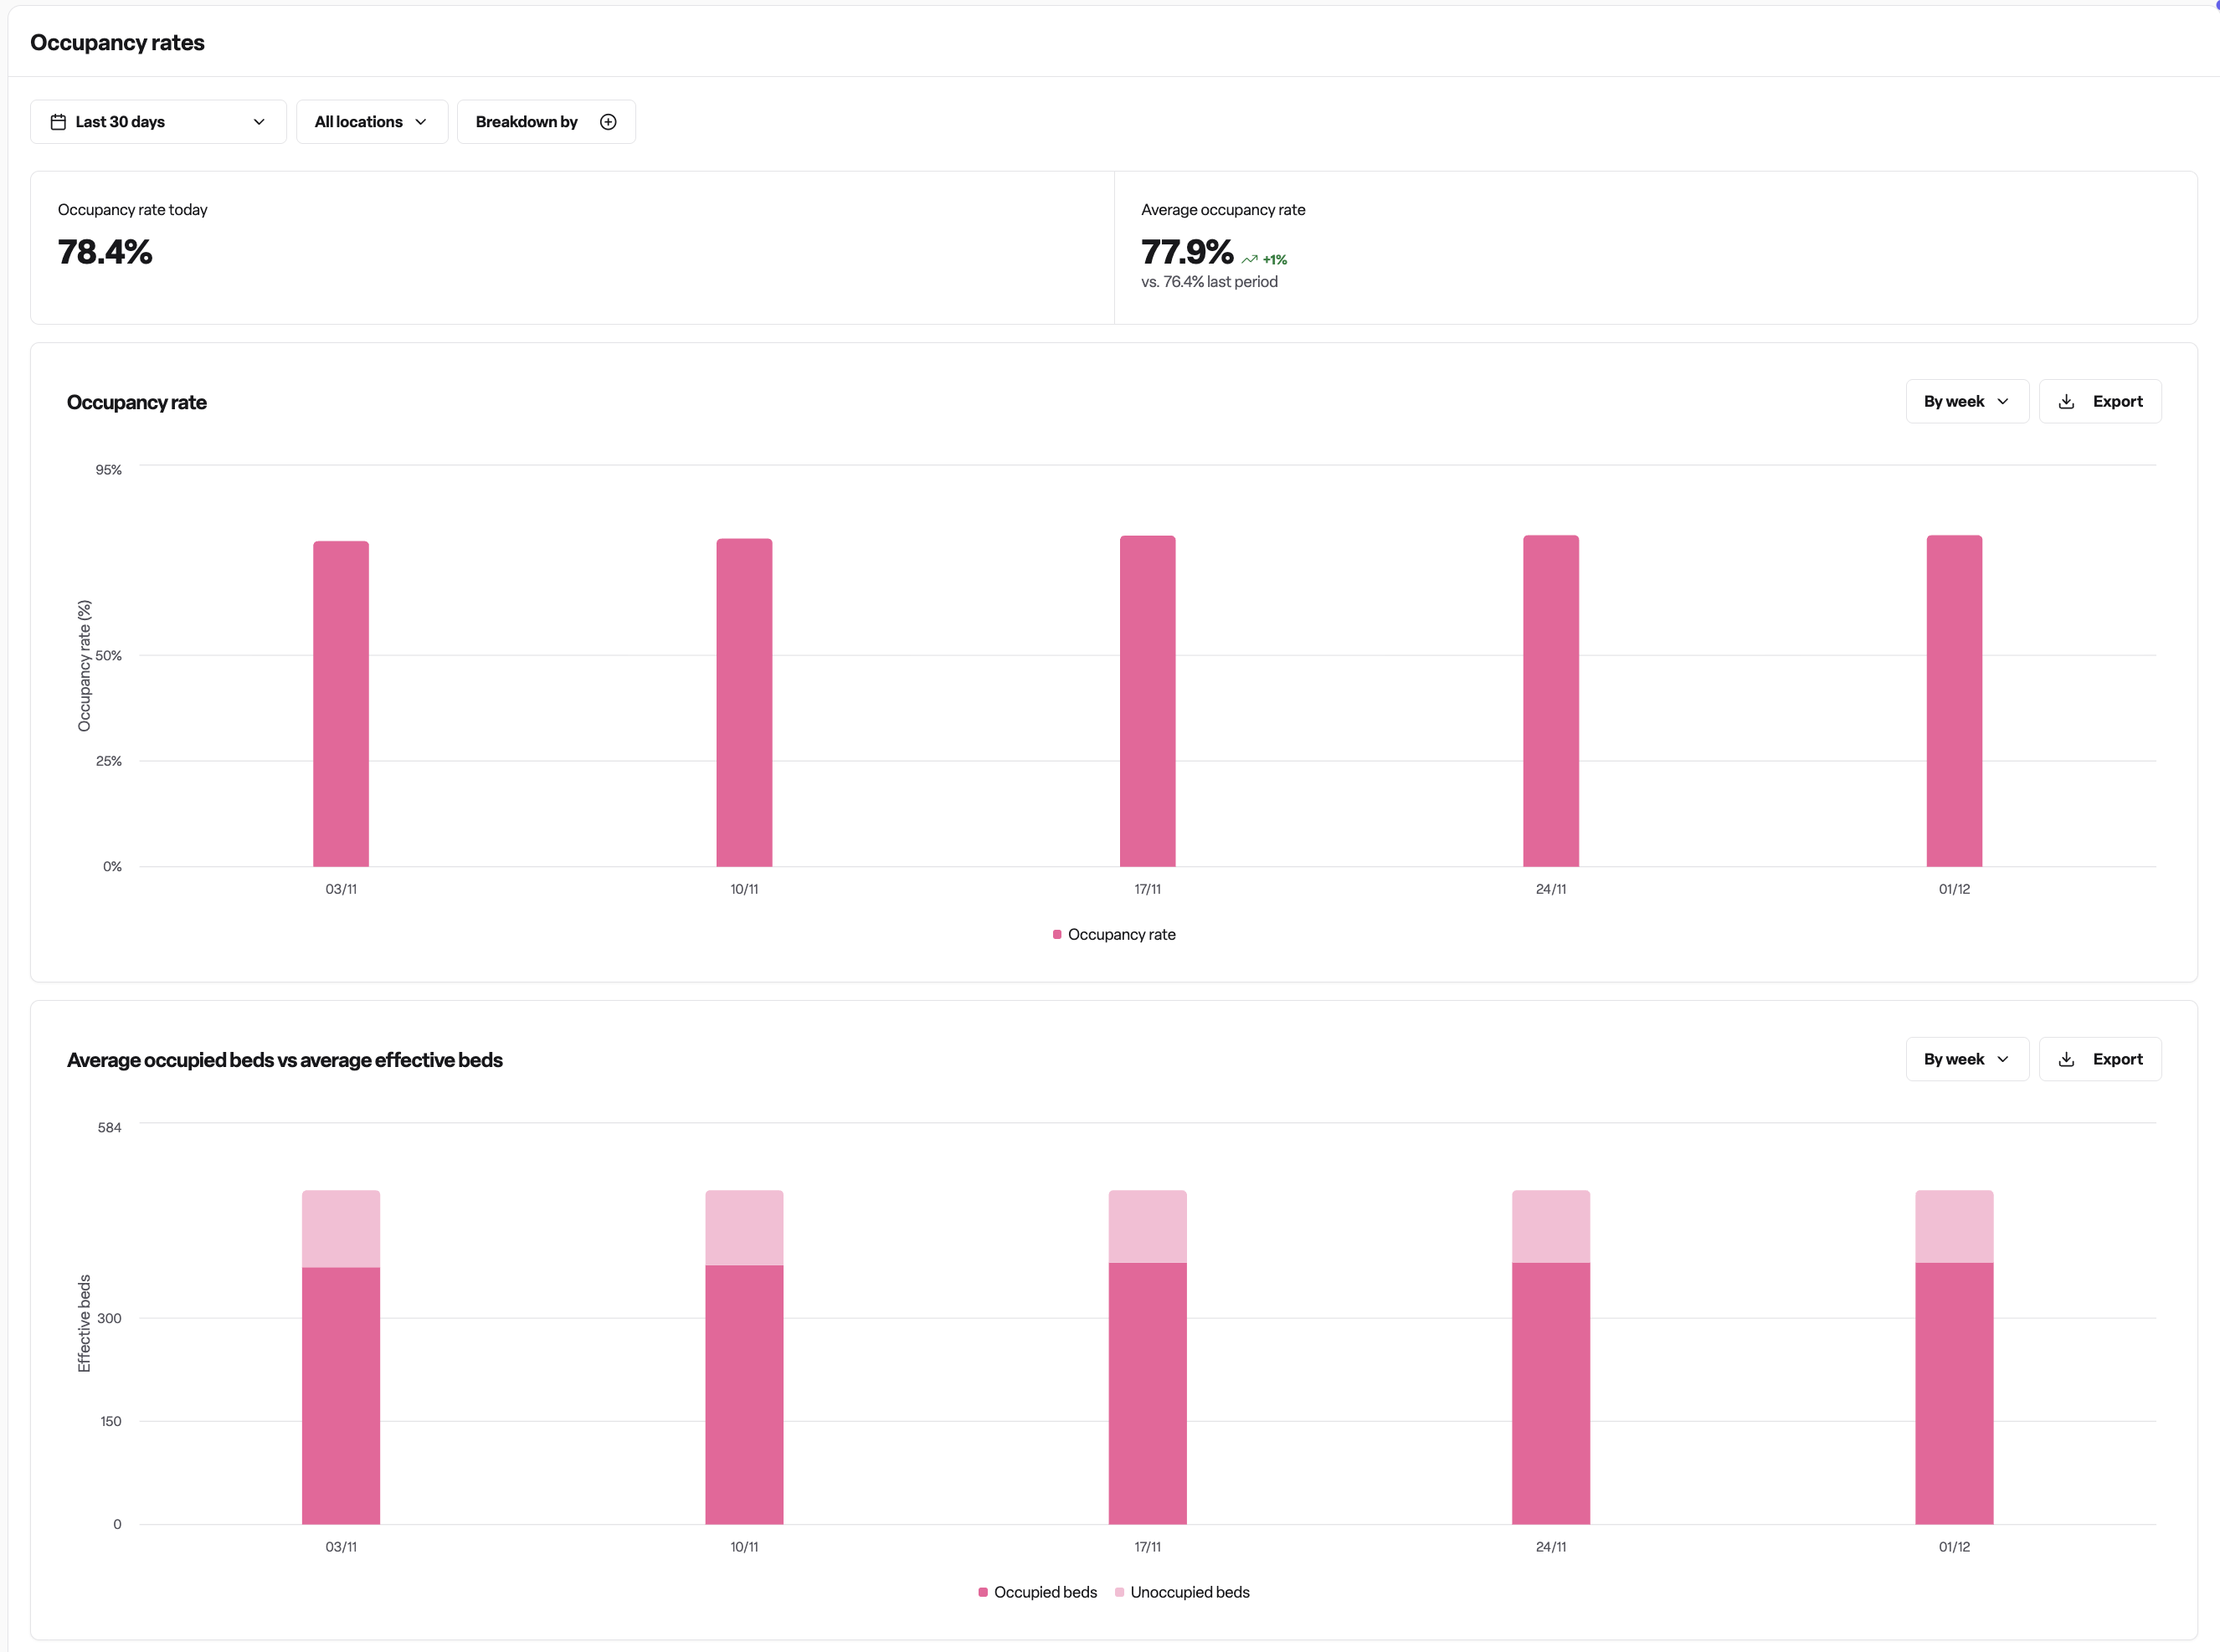
Summary metrics
Occupancy rate today: The current occupancy percentage across your selected locations
Average occupancy rate: The mean occupancy percentage for your selected time period, with a comparison to the previous equivalent period (e.g., if you select a 30-day period, it compares to the previous 30 days)
Occupancy rate chart
A visual chart showing how your occupancy percentage has changed over time
You can group data by day, week, or month to see trends at different levels
Optional breakdowns by care duration type (permanent/respite), care type, or funding type
Occupied beds vs effective beds chart
Shows the actual number of occupied beds compared to your available bed capacity (effective beds)
Helps you see both the raw numbers and patterns in capacity utilisation
Can be grouped by day, week, or month
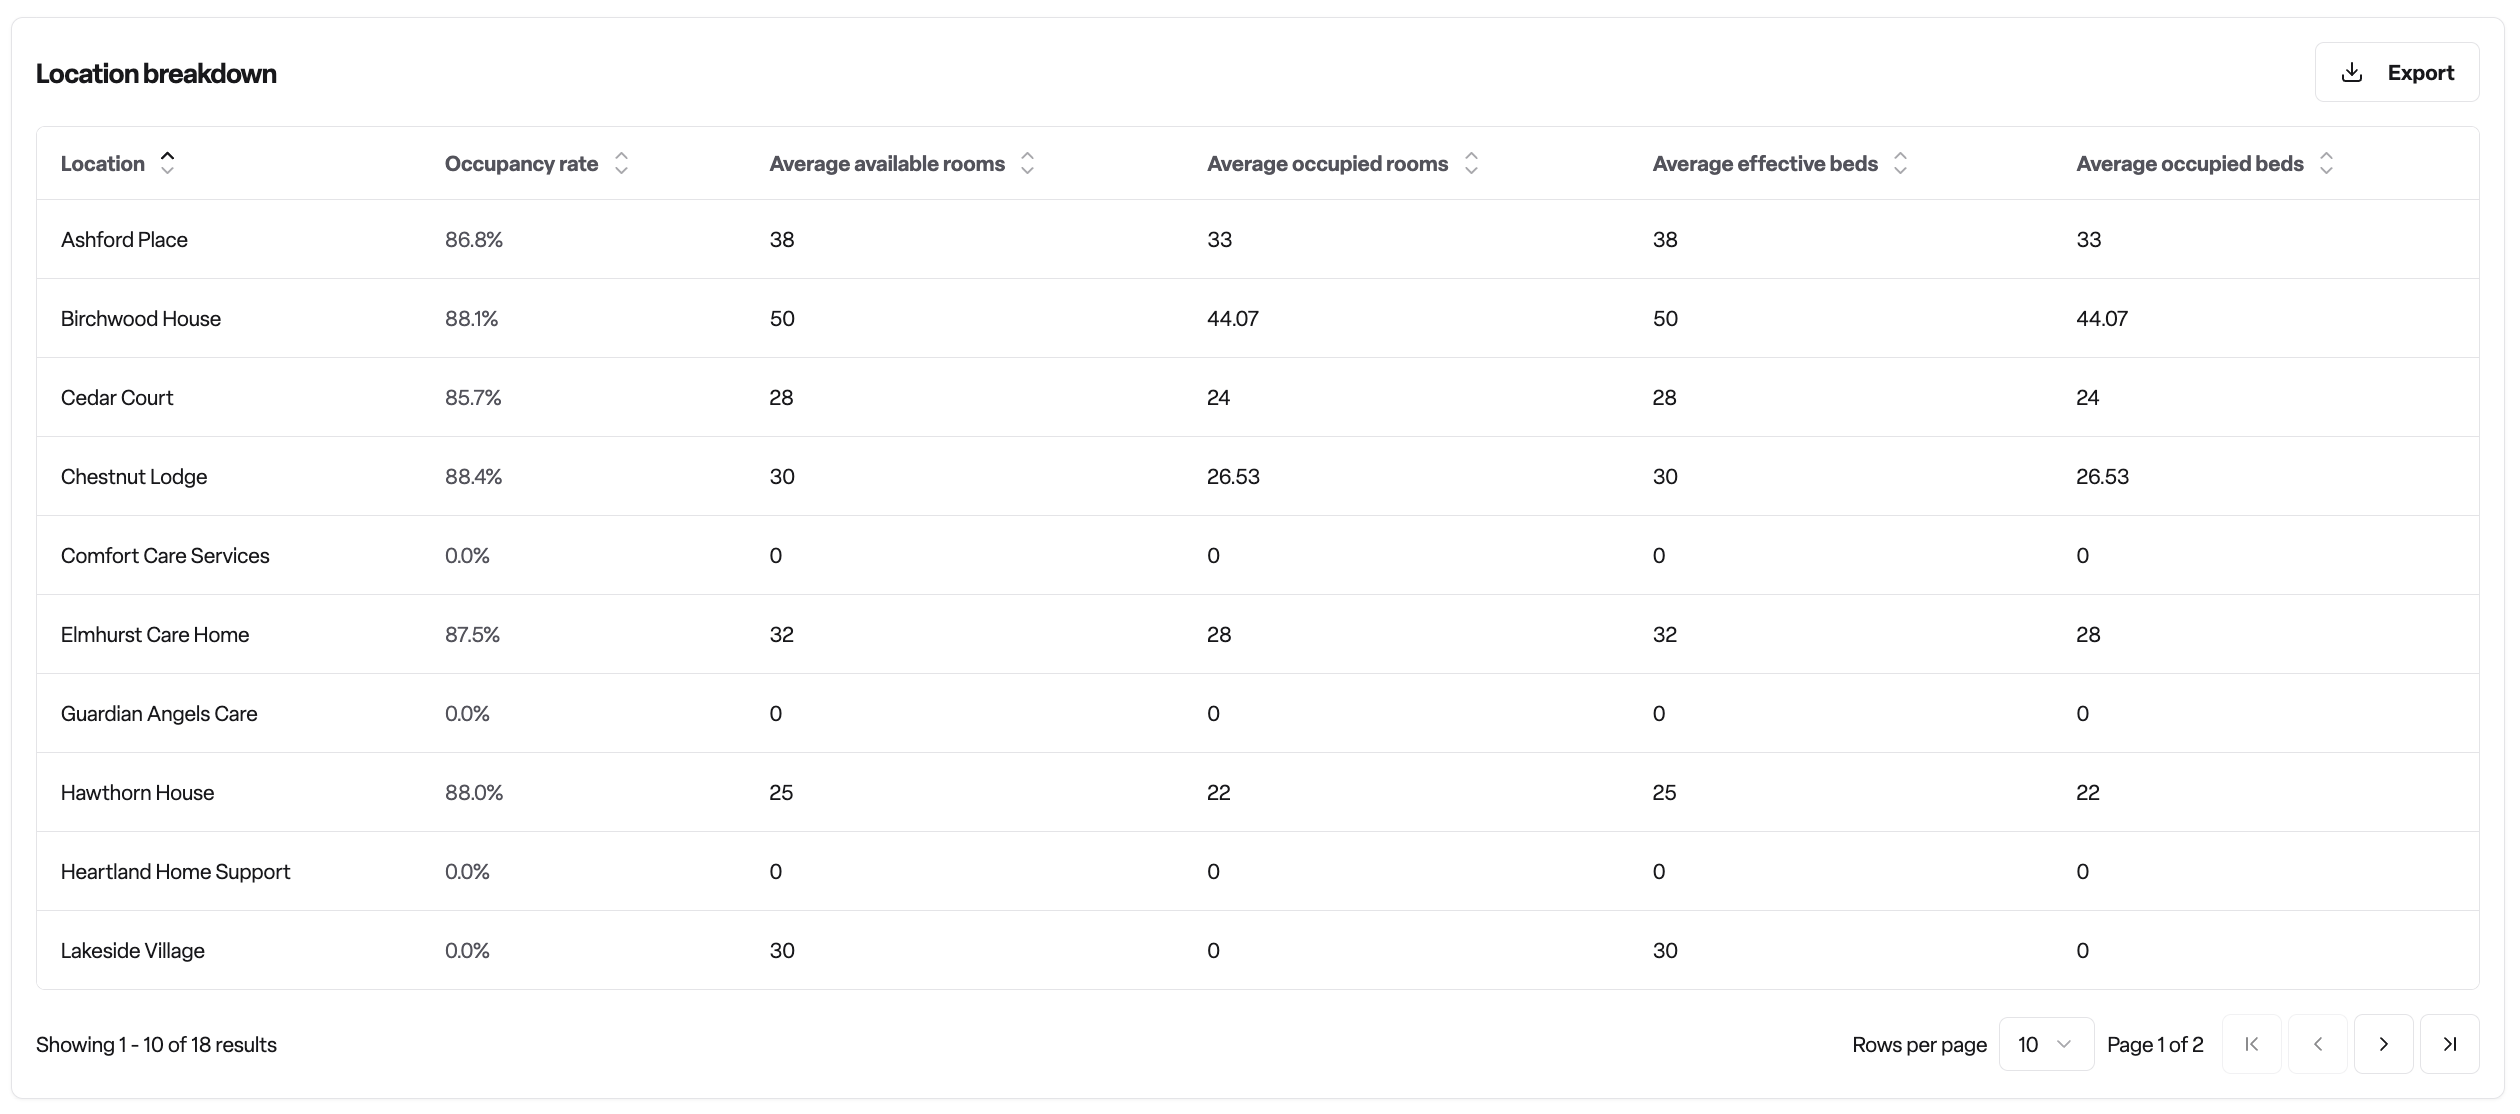
Location breakdown table
Detailed statistics for each location, including:
Occupancy rate (%)
Average available rooms
Average occupied rooms
Average effective beds
Average occupied beds
How the calculation works
Occupancy rate is calculated as:
(Occupied beds ÷ Effective beds) × 100
Effective beds represents your actual available capacity, which is:
Total bed capacity across all rooms
Minus beds in closed rooms (rooms marked as temporarily closed)
Occupied beds counts:
One bed per active room assignment
Only includes permanent and respite care bookings
Excludes day care bookings
How to use the report
Accessing the report
Navigate to the Reports section in Found
Select "Occupancy rates" under Occupancy from the available reports
Filtering your data
Select a time period
Use the date range selector to choose your reporting period
Common selections include last 7 days, last 30 days, last 3 months, or a custom range
Choose locations
Select one or more locations to include in the report
If no locations are selected, all accessible locations are included
Apply breakdowns (optional)
Break down occupancy by:
Care duration type: See separate trends for permanent vs respite care
Care type: Compare occupancy across different types of care (e.g., residential, nursing, dementia)
Funding type: Analyse occupancy by funding source (e.g., local authority, private, NHS)
Adjusting chart views
Group data by time period
Each chart can be grouped independently
Choose between daily, weekly, or monthly grouping
Weekly grouping starts on Monday
Monthly grouping uses calendar months
Exporting data
Both charts include export buttons that allow you to download the data for further analysis or reporting purposes.
Frequently asked questions
Q: Why does my occupancy rate differ from manual calculations?
A: The report automatically excludes closed rooms from available capacity and only counts permanent and respite care bookings. Day care bookings are excluded from occupancy calculations. Check that room closures are correctly recorded in the system.
Q: What counts as an "effective bed"?
A: Effective beds represent your actual available capacity. This is your total bed capacity minus any beds in rooms that are temporarily closed during the reporting period.
Q: Why do day care bookings not count towards occupancy?
A: Day care services don't require overnight bed allocation, so they're excluded from occupancy calculations to give an accurate picture of your residential bed utilisation.
Q: How does the comparison period work for average occupancy?
A: The system automatically calculates the comparison period based on your selected date range. If you select a 30-day period, it compares to the previous 30 days before your selected start date.
Q: Can I see occupancy for a specific room?
A: This report focuses on location-level and organisation-level occupancy. For room-specific information, refer to the room management section or bed management reports.
Q: What's the difference between "available rooms" and "effective beds"?
A: Available rooms counts the number of rooms that aren't closed, whilst effective beds counts the total bed capacity (as some rooms may have multiple beds). For example, 10 available rooms might represent 15 effective beds if some rooms are double occupancy.
Q: Why might effective beds change over time?
A: Effective beds can vary due to room closures for maintenance, refurbishment, or other reasons. The report automatically adjusts the available capacity for each date based on active room closures.
Q: How often is the report data updated?
A: The report displays real-time data based on current room assignments and bookings. Summary metrics refresh every 5 minutes.
Q: What happens if I have no data for the selected period?
A: If there are no room assignments or bookings for your selected time period and locations, the report will display a message indicating no occupancy data is available. Try selecting a different time period or check that locations have active bookings.
Q: Can I see occupancy broken down by multiple factors at once?
A: Currently, you can apply one breakdown at a time (care duration type, care type, or funding type). To analyse multiple dimensions, export the data and create custom views in a spreadsheet application.