Move-ins & move-outs occupancy report
Last updated: December 2, 2025
Pro feature: This feature is available on Pro plans only. If you’d like to upgrade your plan, please contact our support team.
Overview
The move-ins & move-outs occupancy report helps you track resident movements across your care homes over time. This report provides insights into how many residents are joining your homes, leaving your homes, and the reasons for departures.
The report is divided into two main sections:
Overview tab
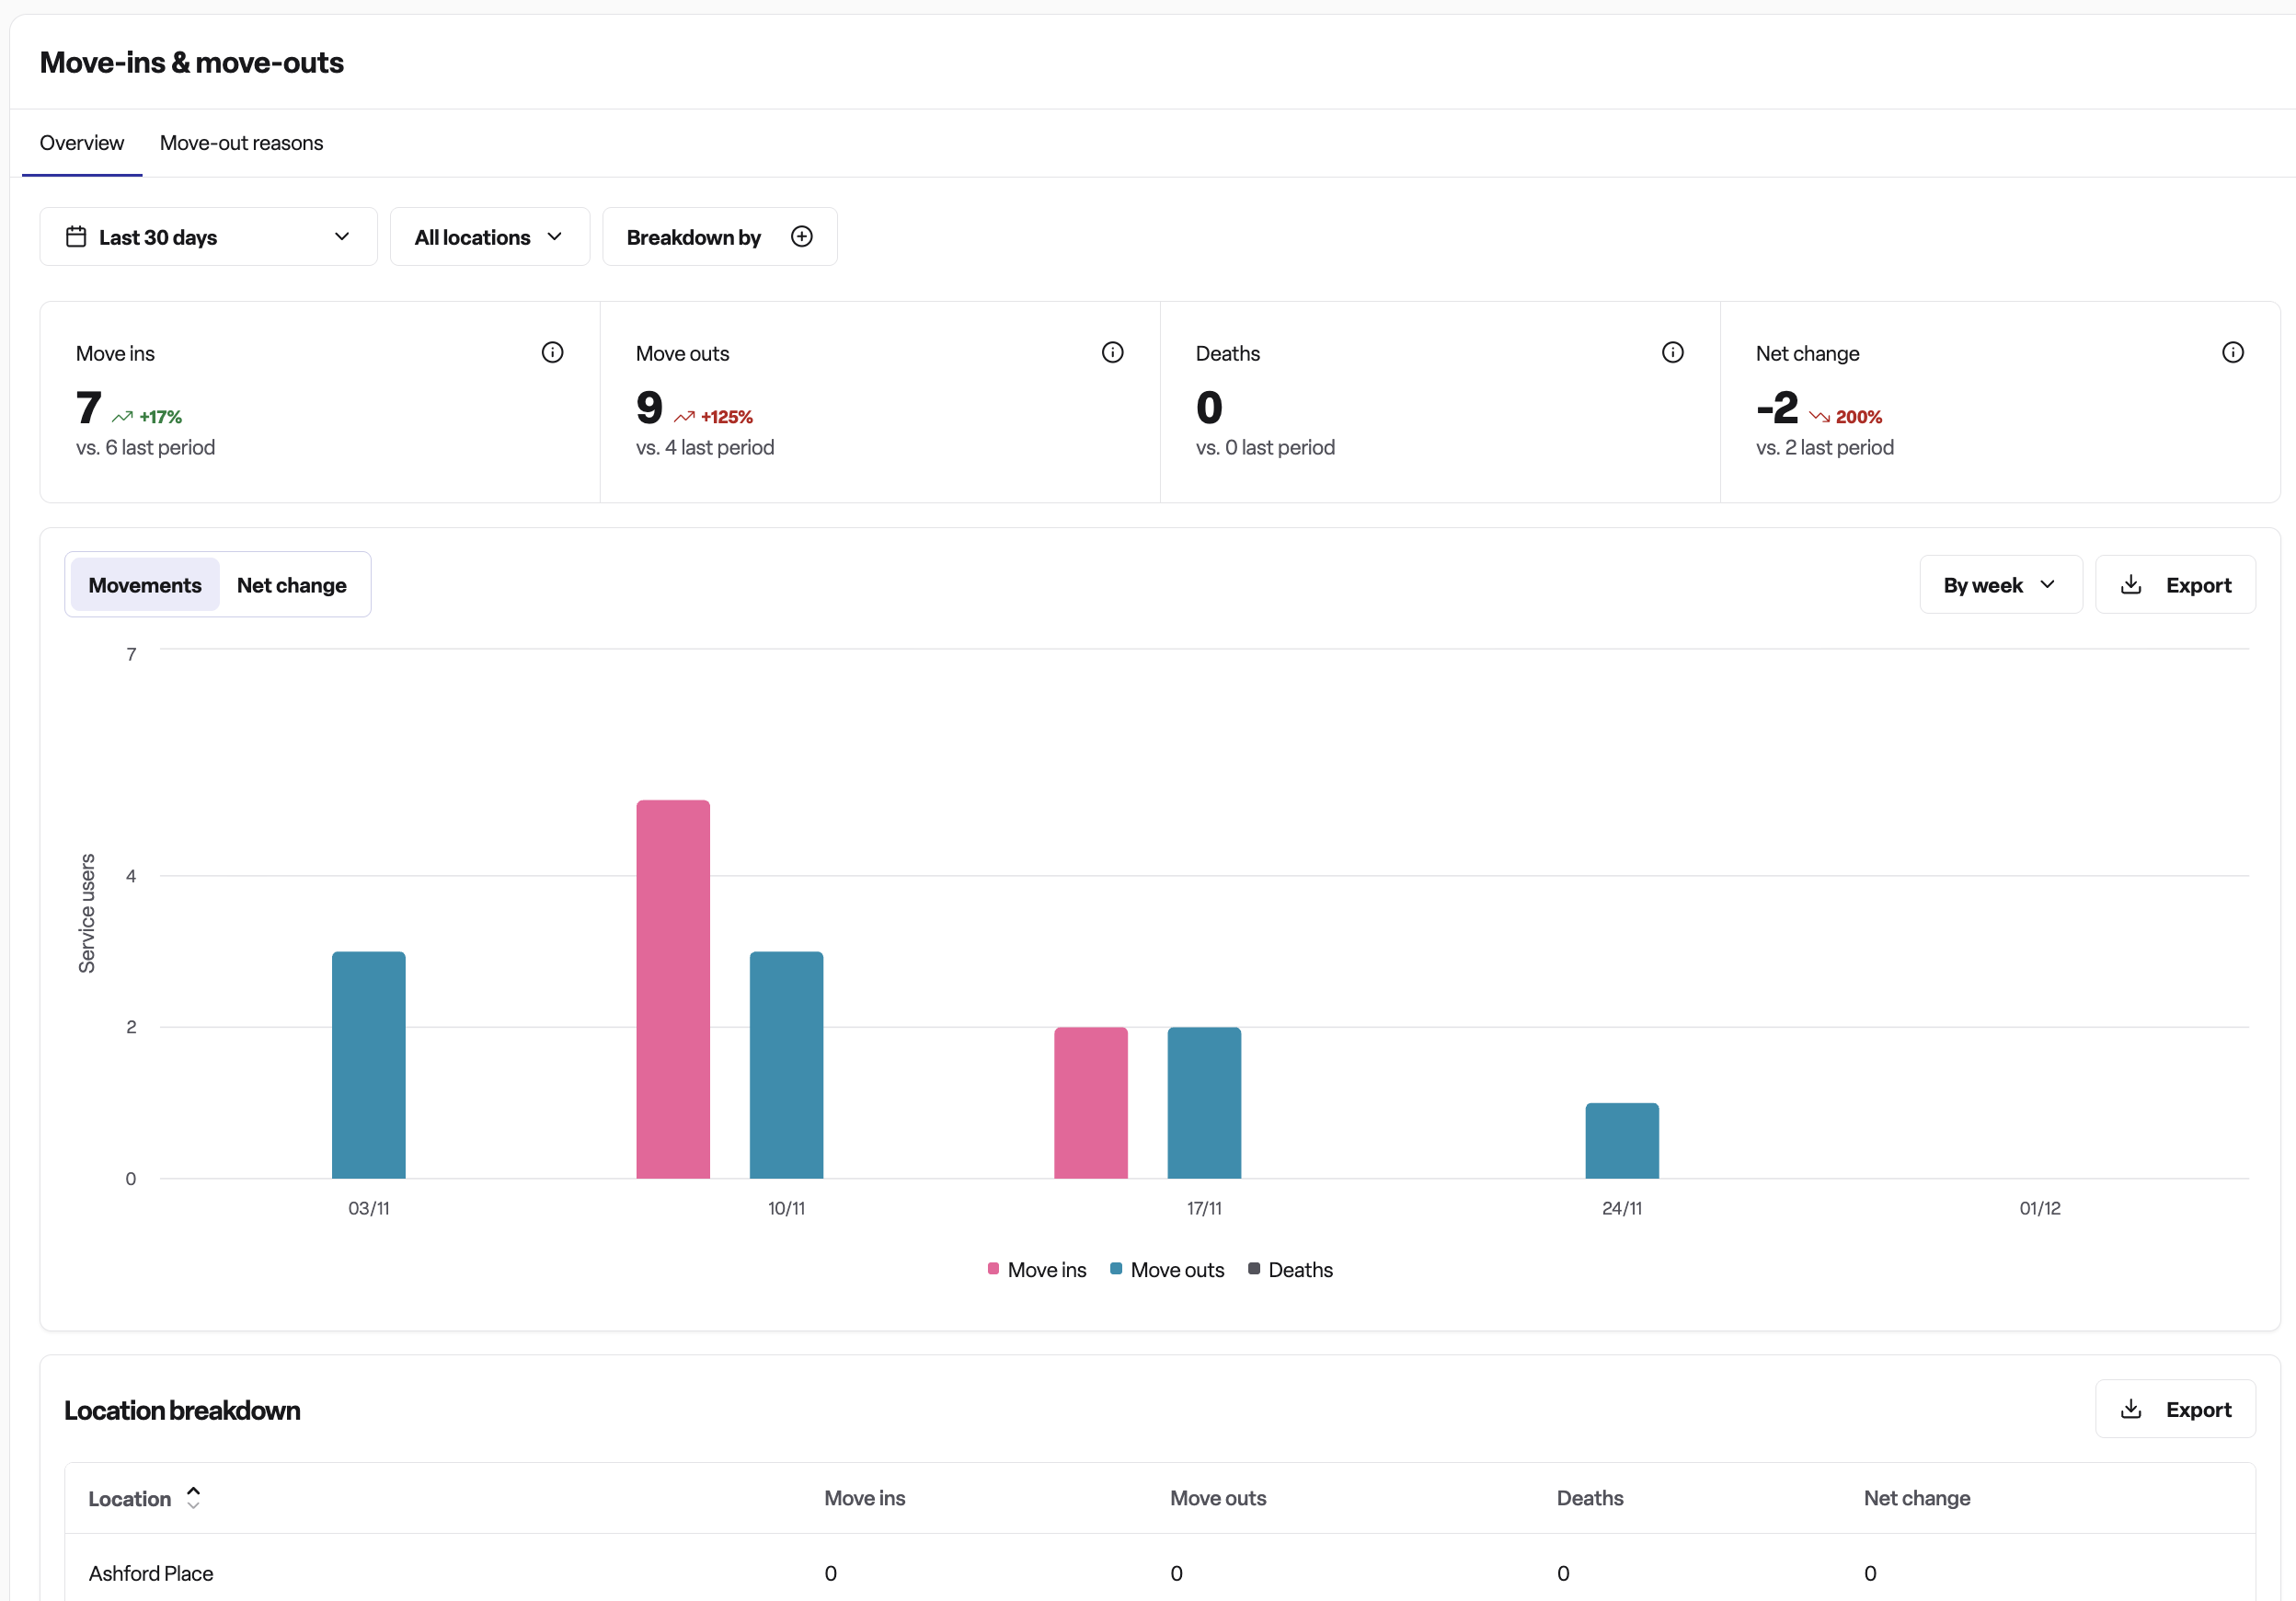
This section displays a complete picture of resident movements, including:
Summary metrics
Move ins: The number of new residents who moved into your homes during the selected time period
Move outs: The number of residents who left your homes during the selected time period (excluding deaths)
Deaths: The number of residents who passed away during the selected time period
Net change: The overall change in resident numbers, calculated as move ins minus move outs and deaths
Each metric shows a comparison with the previous period, helping you identify trends. Green arrows indicate improvement (more move ins or fewer move outs), while red arrows indicate decline.
Charts
Movements chart: Displays move ins, move outs, and deaths over time as a stacked area chart, allowing you to see trends and patterns in resident movements
Net change chart: Shows whether you gained or lost residents overall during each time period, with positive changes shown in green and negative changes in red
Location breakdown table This table breaks down the movement metrics by each of your care home locations, showing which homes have the most activity.
Move-out reasons tab
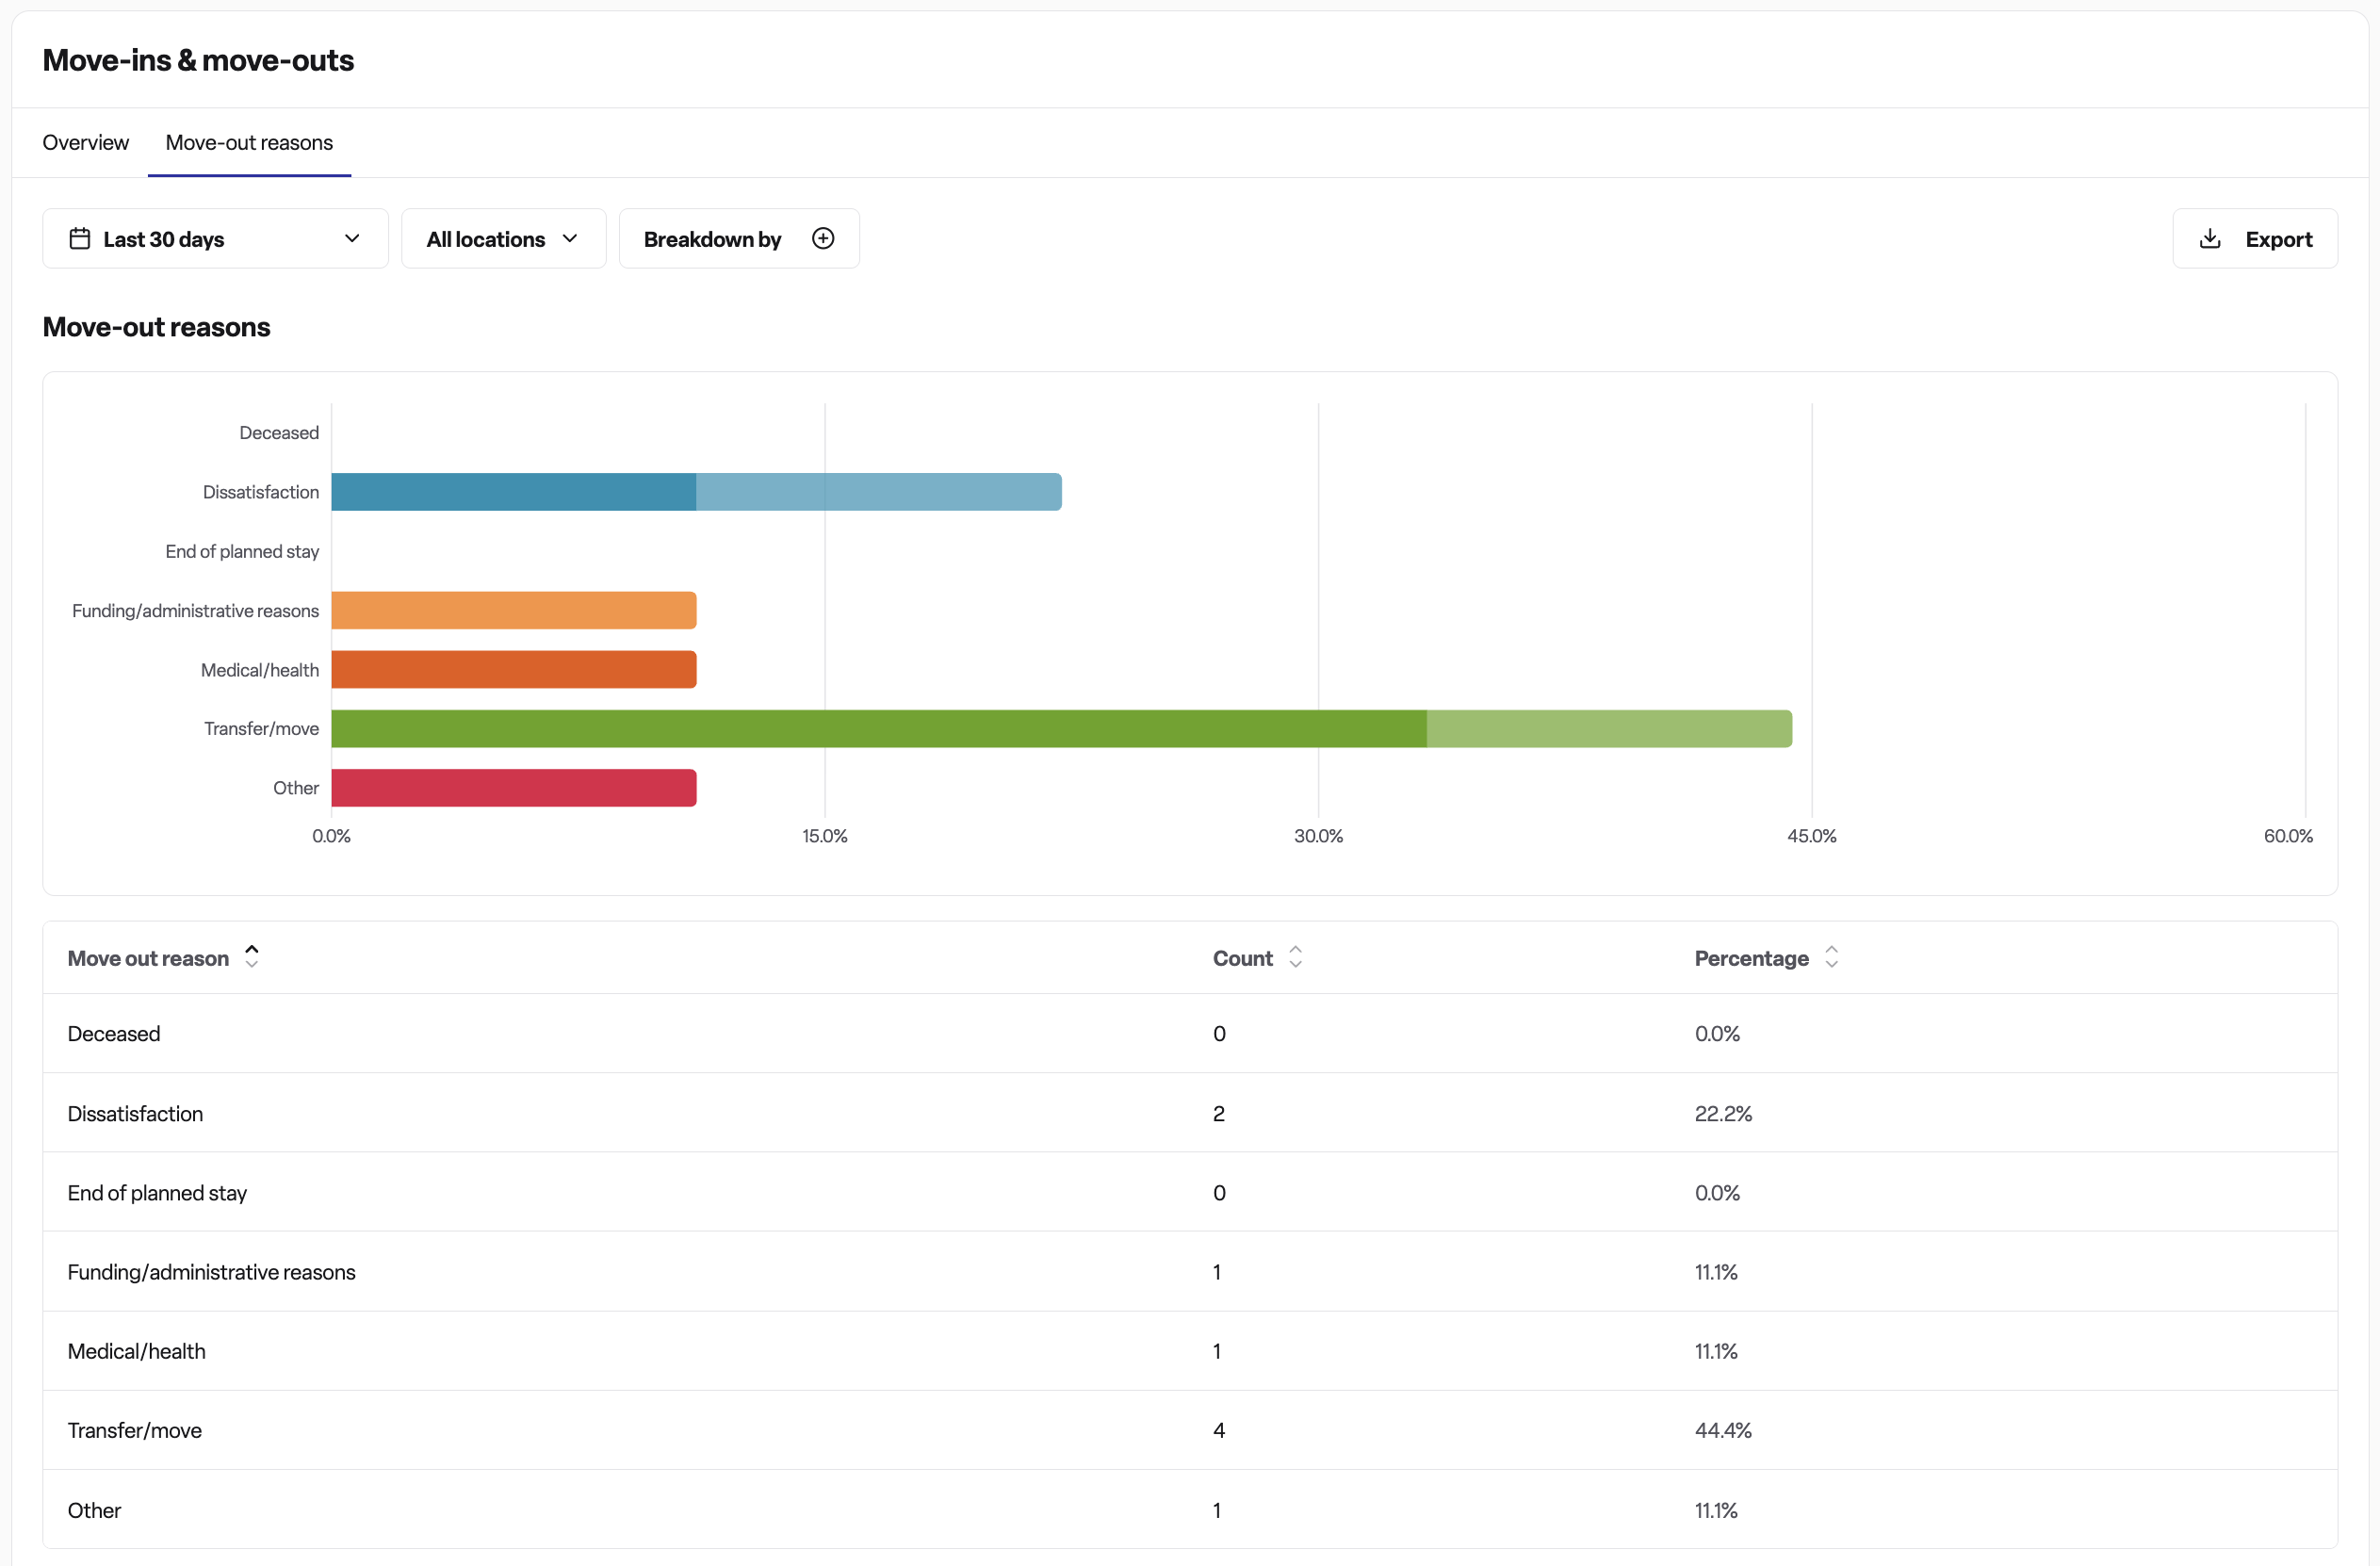
This section provides detailed insights into why residents are leaving your homes. It displays:
A breakdown of all move-out reasons with counts and percentages
The ability to drill down into specific reasons to see which residents moved out for that particular reason
Detailed information including the resident name, location, and specific reason provided
How to use the report
Selecting your date range
Click the date range selector at the top of the report
Choose from preset options (Last 30 days, Last 90 days, etc.) or select a custom date range
The report automatically compares your selected period with the previous period of equal length
Filtering by location
Click the "Locations" dropdown
Select specific locations to include in the report
Leave all locations selected to view organisation-wide data
Changing the time grouping
You can view your data grouped by:
By day: See daily movement patterns (useful for short time periods)
By week: See weekly trends (recommended for periods of 1-3 months)
By month: See monthly patterns (recommended for periods of 3+ months)
Click the grouping selector above the chart to switch between these options.
Using breakdown options
To see how movements vary by resident characteristics, use the "Breakdown by" dropdown to analyse data by:
Care duration: Compare permanent residents vs respite residents
Funding type: Compare private payers, local authority, NHS, etc.
Care type: Compare residential, nursing, dementia care, etc.
Note: The net change chart is not available when using breakdown options, as it becomes difficult to interpret with multiple categories.
Viewing move-out reasons
Click the "Move-out reasons" tab at the top of the report
Review the table showing all reasons for departures
Optionally, use the "Breakdown by" dropdown to drill down into a specific reason
Review detailed information about individual residents who moved out for each reason
Exporting data
Click the "Export" button in the top-right corner of any chart to download the data as a CSV file for further analysis in Excel or other tools.
Frequently asked questions
Q: What counts as a "move in"?
A: A move in is counted when a new booking starts within the selected time period. This includes genuinely new residents entering your home. Bookings that were cancelled or that started from a respite-to-permanent conversion are excluded to avoid double-counting.
Q: What counts as a "move out"?
A: A move out is counted when a booking ends within the selected time period, excluding deaths. This includes residents who:
Returned home
Transferred to another facility
Moved to hospital
Left for other non-death reasons
Deaths are tracked separately to give you clearer insights into voluntary departures vs unavoidable losses.
Q: Why is my net change negative?
A: A negative net change means more residents left (through move outs or deaths) than joined during the selected period. This could indicate:
Seasonal patterns (e.g., fewer admissions during holidays)
Capacity constraints or bed unavailability
Marketing or sales challenges
An ageing resident population with higher mortality
Review the trends over time and compare with previous periods to identify whether this is a temporary fluctuation or an ongoing pattern.
Q: How are dates counted for move outs and deaths?
A: Move outs and deaths are counted based on the last night the resident occupied a bed. For example, if a resident's end date is 15th January, they are counted as leaving on 14th January (their last night in the home). This ensures accurate occupancy calculations.
Q: What does "net change" tell me?
A: Net change is the overall impact on your resident numbers during the period. A positive net change means you gained residents overall, while a negative net change means you lost residents. This metric is useful for understanding whether your occupancy is growing or declining over time.
Q: Why can't I see the net change chart when I've selected a breakdown option?
A: The net change chart combines all move ins, move outs, and deaths into a single trend line. When you break down the data by care duration, funding type, or care type, you create multiple separate categories. Showing net change for each category simultaneously would make the chart confusing and difficult to interpret. To view net change, clear your breakdown selection using the "Clear selection" option in the breakdown dropdown.
Q: Can I compare multiple locations?
A: Yes! Select multiple locations from the location dropdown, and the charts will show combined data for all selected locations. The location breakdown table will then show you how each location contributed to the overall numbers.
Q: What's the difference between the overview and move-out reasons sections?
A: The overview section shows you the high-level patterns of all resident movements over time. The move-out reasons section provides detailed analysis specifically about departures, helping you understand why residents are leaving. Use the overview to spot trends, and the move-out reasons section to investigate the underlying causes.
Q: Why might my move-out counts differ from what I expect?
A: The report excludes certain types of booking endings to provide accurate move-out statistics:
Cancelled bookings (which never actually started) are excluded from move ins
Respite bookings that converted to permanent bookings are excluded from move ins (to avoid double-counting)
Deaths are tracked separately from move outs
Successful conversions (e.g., respite to permanent) are excluded from move outs
This ensures the report accurately reflects genuine resident movements rather than administrative changes.
Q: How often is the report data updated?
A: The report displays data in real-time based on the bookings and booking endings recorded in Found. When you add or modify booking information, it will be reflected in the report immediately.