Weekly fees report
Last updated: March 23, 2026
Pro feature: This feature is available on Pro plans only. If you’d like to upgrade your plan, please contact our support team.
Overview
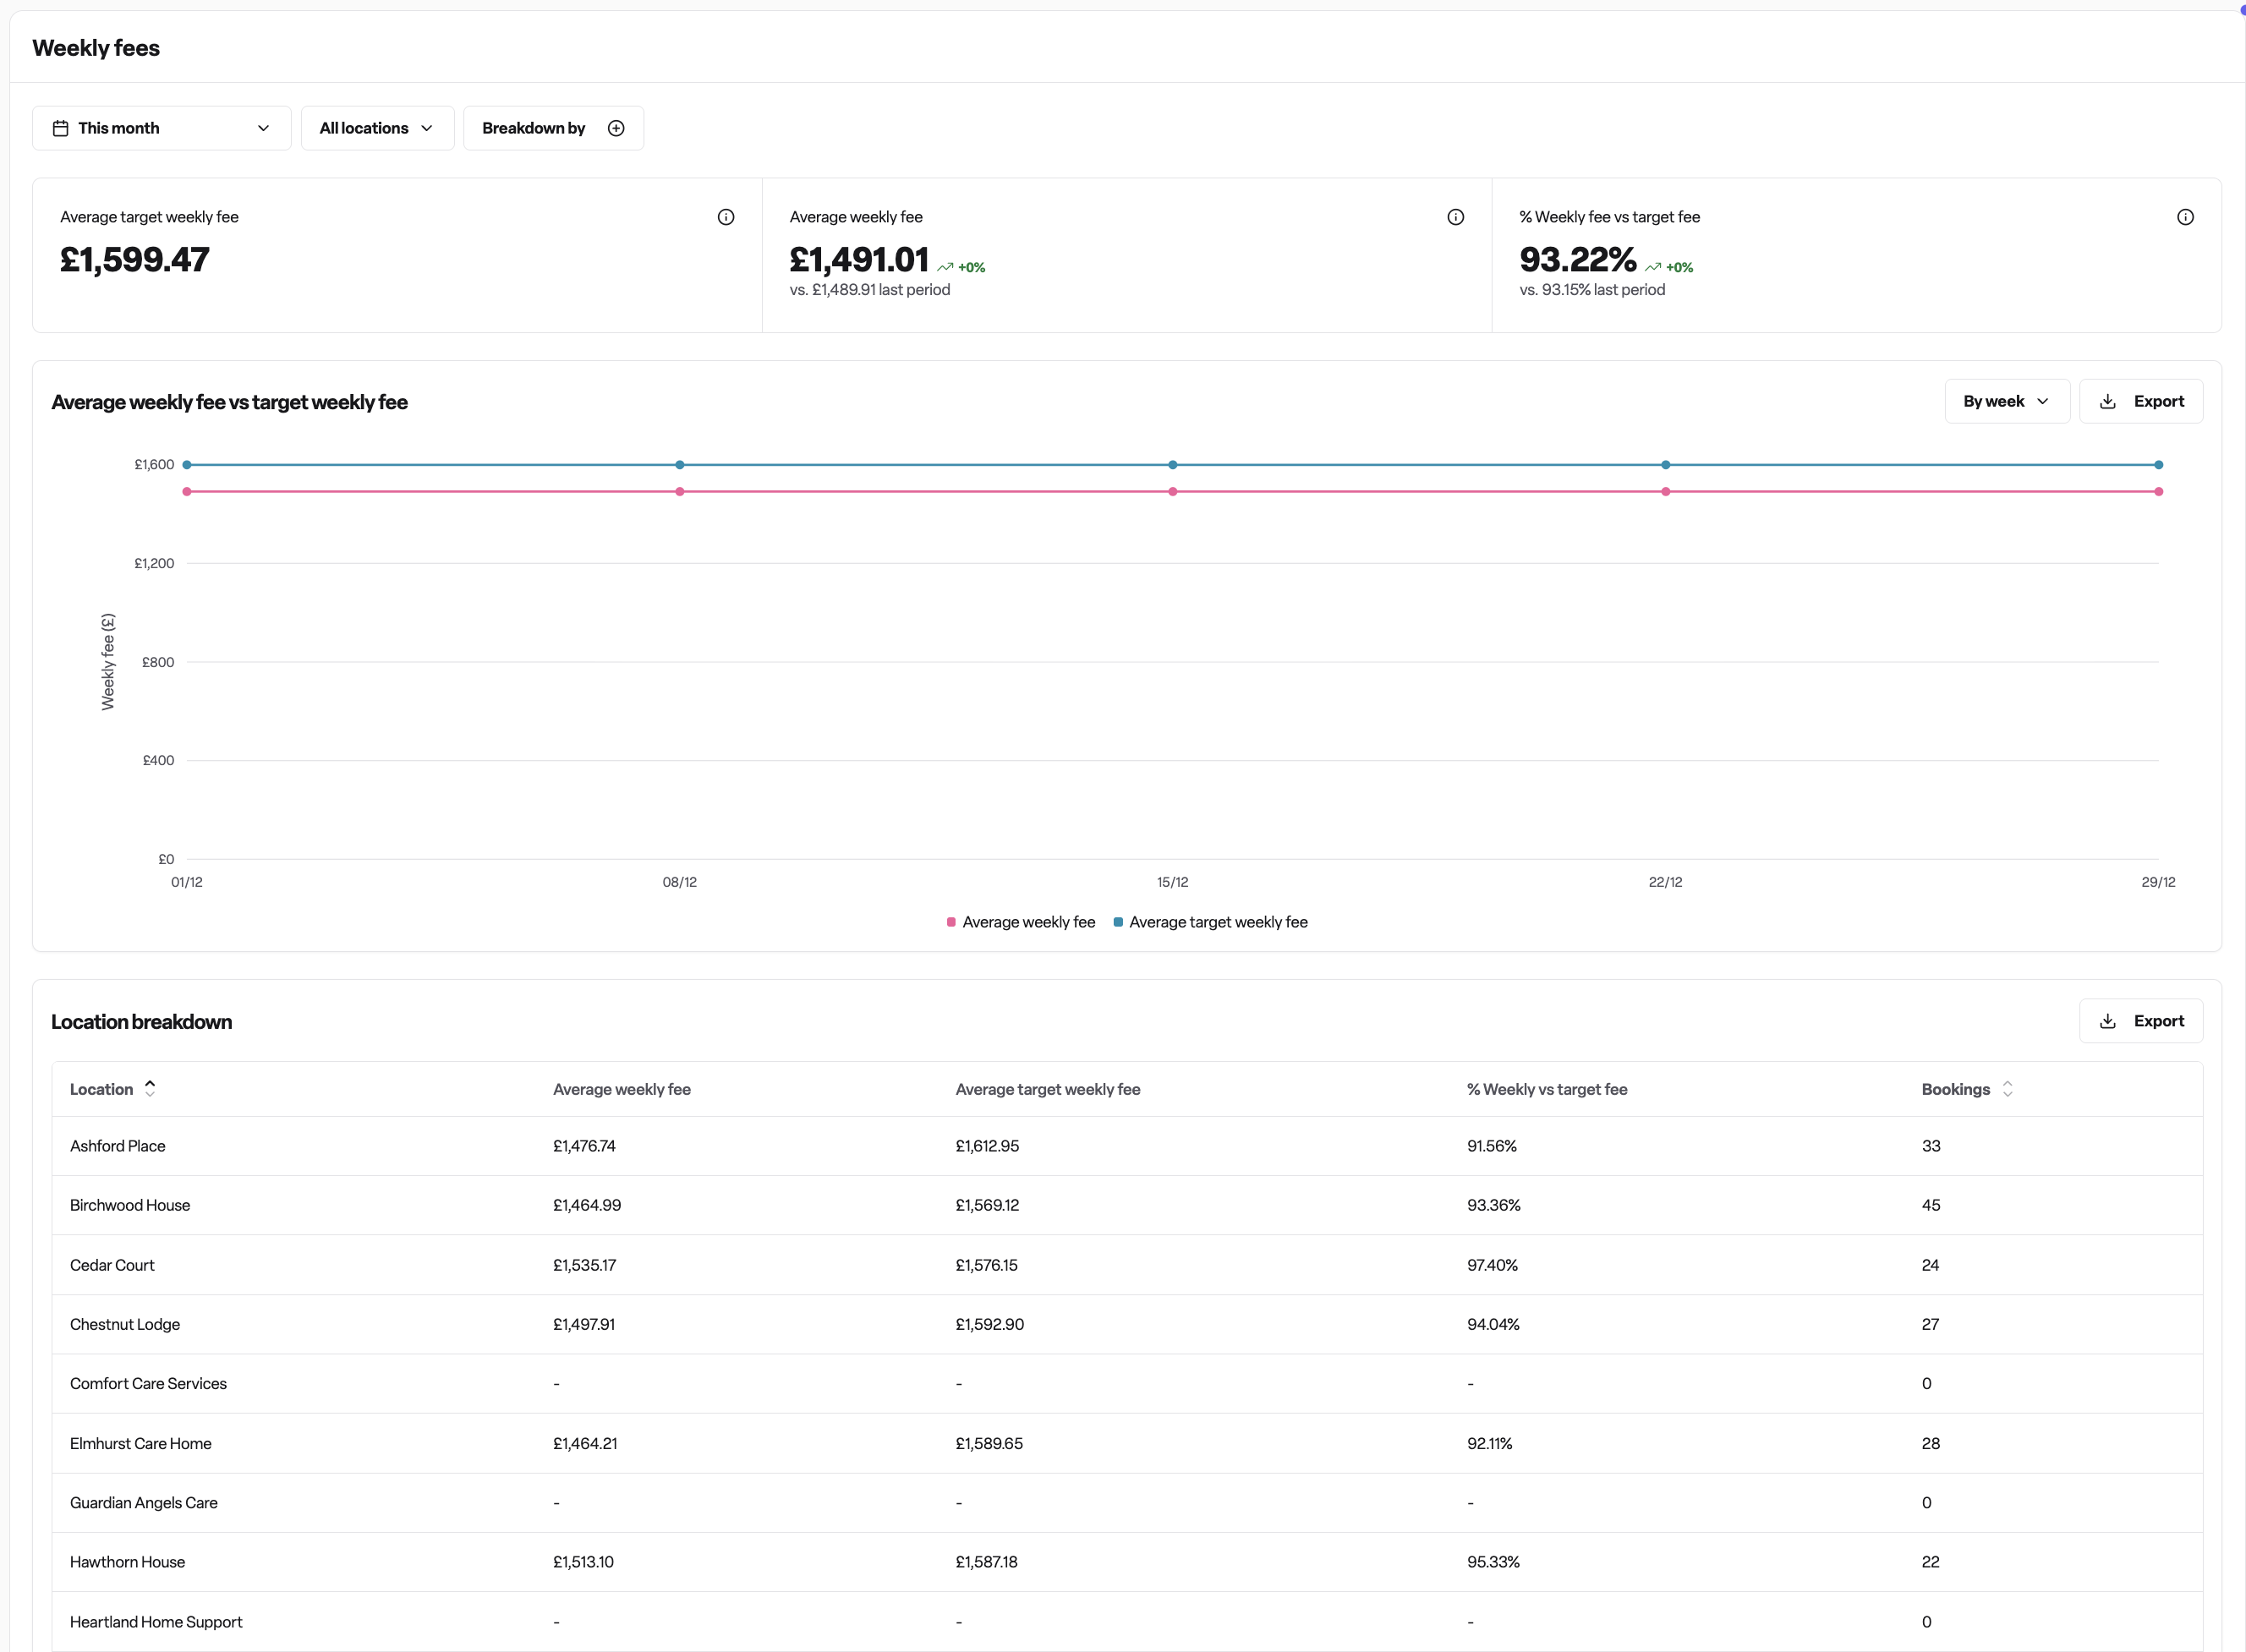
The Weekly fees report helps you understand how your actual weekly fees compare to your target fees across your organisation. This report provides insights into fee performance over time and across different locations.
The report displays three key metrics:
Average target weekly fee: The average fee you're aiming for, based on the target fees set across all your rooms
Average weekly fee: The actual average weekly fee from all service user bookings during the selected period
% Weekly fee vs target fee: Shows how your actual fees compare to your targets as a percentage (for example, 95% means your actual fees are 95% of your target fees)
Each metric shows a comparison to the previous period, allowing you to track trends and identify changes in fee performance.
The report includes a visual chart that plots your average weekly fees against target fees over time, helping you spot trends and patterns. You can group the data by day, week, or month depending on your needs.
A location breakdown table provides detailed performance data for each location, including:
Average weekly fee per location
Average target weekly fee per location
Percentage comparison
Number of bookings
How to use the report
Accessing the report
Navigate to Reports > Occupancy > Weekly fees in Found.
Filtering and viewing options
Date range: Use the date range selector to choose the period you want to analyse. The report will automatically compare this to the previous period of equal length.
Locations: Filter by specific locations to focus on particular care homes or view all locations together.
Group by: Change how the data is grouped (by day, week, or month) to match your reporting needs. Weekly grouping works well for most analysis, whilst monthly grouping is useful for longer-term trends.
Break down by: Add an additional layer of analysis by breaking down the data by:
Care duration type (permanent or respite care)
Funding type (how the placement is funded)
Care type (the type of care being provided)
Understanding the data
The report only includes active bookings with weekly fees set. It excludes:
Cancelled bookings
Bookings that have ended
Day bookings (bookings with care duration type of "Day")
Bookings without a weekly fee
Target fees are based on the room target weekly fees you've configured for each room. The report uses the target fee that was active on each date in the reporting period.
Calculation
Average weekly fee = Sum of weekly fees for service users with current bookings (care duration = permanent or respite) ÷ number of service users with current bookings (care duration = permanent or respite)
Exporting data
The location breakdown table can be exported to CSV for further analysis or reporting in other tools.
Frequently asked questions
Q: Why is my average weekly fee showing as lower than expected?
A: The average is calculated across all active bookings during the period. If you have a mix of different fee levels, new admissions at lower rates, or rooms with varying target fees, this will bring the average down. Use the location and breakdown filters to identify which areas are affecting the average.
Q: What does the percentage comparison mean?
A: The percentage shows your actual weekly fees as a proportion of your target fees. If you see 100%, your actual fees match your targets exactly. Below 100% means you're achieving less than your targets, whilst above 100% means you're exceeding them.
Q: Why are some dates showing no data on the chart?
A: This typically occurs when there were no active bookings with weekly fees during that period. The target fee line will still show data based on your room target fees.
Q: How is the previous period comparison calculated?
A: Found automatically calculates the previous period by going back the same number of days as your selected date range. For example, if you select a 30-day period, it compares against the 30 days immediately before that period.
Q: Can I see weekly fees for individual service users?
A: This report shows aggregated data. To view individual service user weekly fees, navigate to the specific booking record and view the "Weekly fees" tab.
Q: What happens if I change a room's target fee during the reporting period?
A: The report uses the target fee that was active on each specific date. If you changed a target fee mid-period, the report will use the old target for dates before the change and the new target for dates after.
Q: Why do the numbers differ between the chart and the location breakdown table?
A: The chart shows data over time and can be grouped by day, week, or month. The location breakdown table shows the average across the entire selected date range for each location. Both are calculated from the same underlying data but present it differently.
Q: What does it mean when a location shows "-" instead of values?
A: A dash (-) indicates there were no bookings with weekly fees at that location during the selected period, or there was no target fee set for the rooms at that location.